This thread has been locked.

If you have a related question, please click the "Ask a related question" button in the top right corner. The newly created question will be automatically linked to this question.

AWR1642: AWR1642 - Solution (IWR1642)

Part Number: AWR1642

Hello,

my customer have AWR1642 radar sensor. they in Optimal working on 2 projects related to sensing capabilities in biomedical industry.

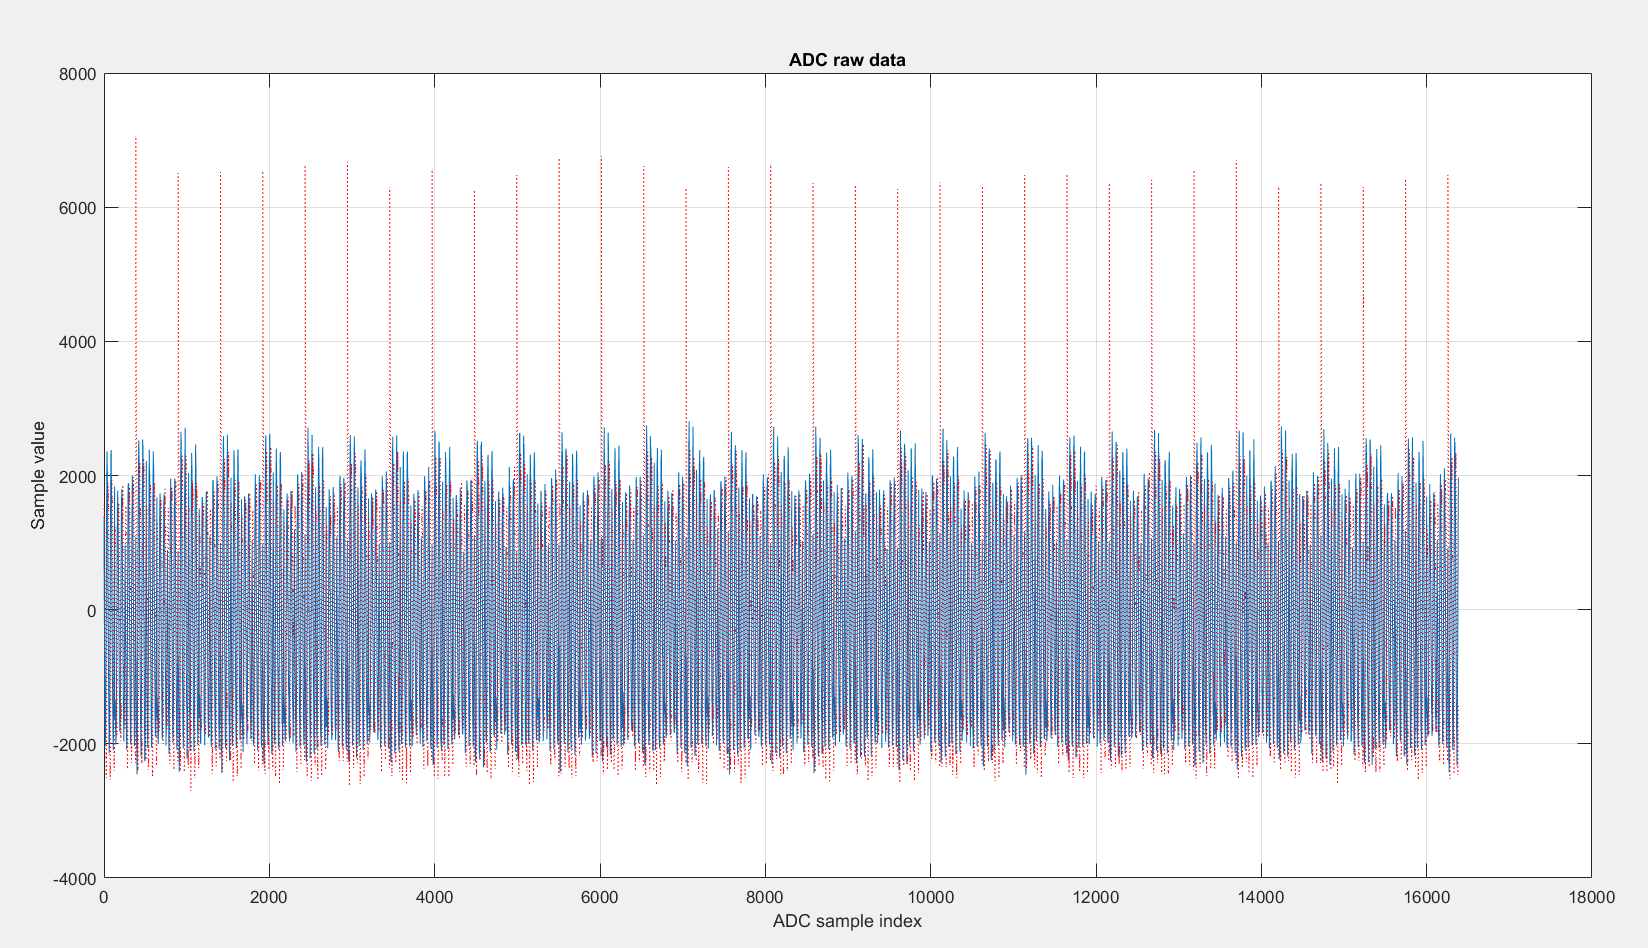
they need sensor how can measure "raw" data – amplitude, phase and frequency of operation.

they need very clear instructions how to do it.   

also they want to know about solution above 100GHz. hope someone could advice.

best regards,

shahaf

  • Hello Shahaf,

    We can guide you with steps for capturing Raw Data out of the Device and how to interpret it.
    Based on this information the computation of Amplitude, phase and frequency will have you be done outside using mathematical tool such as Matlab.


    Can you please clarify the "solution above 100GHz" question?

    Thank you,
    Vaibhav
  • Dear Vaibhav,

    Regarding AWR1642 for range 76-81GHz:
    Please guide me how to do it with Matlab.
    It is very urgent. I'll be more than happy get this information very ASAP.

    Regarding 100GHz:
    Not now, but in near future I may need chip for 100GHz if current AWR1642 for range 76-81GHz will not be enough.


    Thanks,
    Zalman Ibragimov

  • Hello Zalman,

    To capture the raw ADC data, you can use the instructions in this guide. The guide is for the xwr1443, but the same principles should apply for the xwr1642. 

    1777.ADC Data Capture SDK1.05 V1.00.pdf

    To process the raw data, you can use the matlab file located at C:\ti\mmwave_sdk_01_00_00_05\packages\ti\demo\xwr16xx\capture\gui.

    Regards,

    Adrian

  • Dear Adrian,

    Can you send me please example of ADC data and raw data processed using matlab file?

    Thanks,
    Zalman
  • ello Zalman,

    Below is an example of raw ADC data and the file used to process it.

    adc_data_128samples_64frames.dat

    https://e2e.ti.com/cfs-file/__key/communityserver-discussions-components-files/1023/capture_5F00_demo.m

    Regards,

    Adrian

  • Hi Adrian,


    Thanks a lot for your prompt response.

    Attached pic1 of result I got from your sample file.

    Please explain what I see.

    I need from AWR1642 very simple data:

    1. Amplitude of reflected wave as function of frequency

    2. Phase of reflected wave as function of frequency.

    Please assist.


    Thanks,

    Zalman


  • Hello Zalman,

    Your picture is not showing up, however I have updated my above post with some better data. The data I posted before did not look correct to me when I tried to plot it. What you should see if you plot the updated data are the following two plots:

    Where the first plot is simply the raw real and imaginary ADC data and the second plot is the 1D FFT which shows a peak for a single detected object roughly 1m away. If you zoom in on the first plot you can see the real (solid line) and imaginary (dotted line) parts of the raw ADC data more clearly. It should be a sine wave whose frequency is a function of the distance of the object. 

    In order to compute the 

    1. Amplitude of reflected wave as function of frequency

    2. Phase of reflected wave as function of frequency

    You would need to modify the code to make the computations using the obtained ADC data. In the code provided, the ADC data is stored in a two dimensional array called 'rad_in', where the first column contains the real part and the second column contains the imaginary part.

    Regards,

    Adrian

  • Dear Adrian,


    Please send me list of software tools I need install and step  by step instructions what to install and how to run the application – including saving data from which I can recover raw data of amplitude, phase , and frequencies.


    Thanks,

    Zalman