


Hi,
I am trying to read the dump file (raw data) that was created using Radar Studio. I am using AWR 1443 and TSW 1400 to create the file. I used the single Rx configuration (first Rx) as a test configuration. When I read the file, I got sequence of data like this:
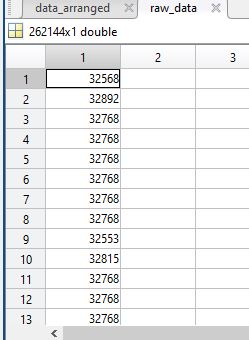
Then after adjusting for the offset value (2^15) and arranging the data, I got something like this :
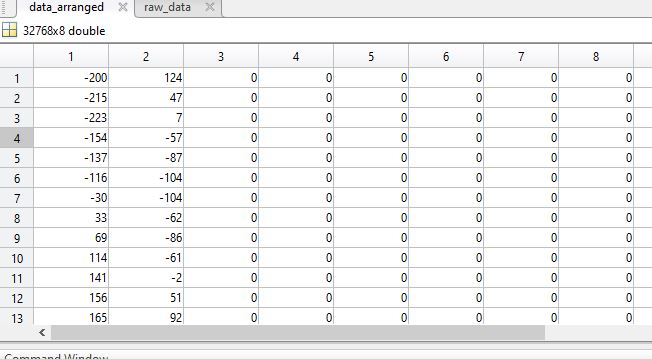
First column represents I data for 1st Rx and second column represents Q data for 1st Rx. Since I used only one Rx, values corresponding to other Rx were zeroes as expected.
When I plot the time domain plot using this data for 1st chirp , I got something like this :

But the plot that was given by Radar Studio Post Processing was slightly different. The nature of the plot was similar but the real part seemed to be slightly clamped downwards and imaginary part was seemed to be clamped upwards.
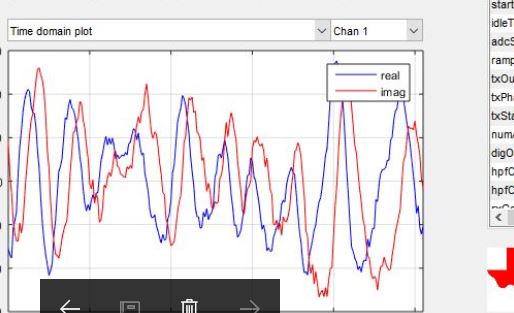
Could you please help me with this? Do I need to do further calculations to get the accurate data?
Regards,
Yunish
