


Hi,
I was able to read the raw data that was created by Radar Studio when AWR 1443 was used with TSW 1400. Now I need to get the range profile of the data.I have following confusions:
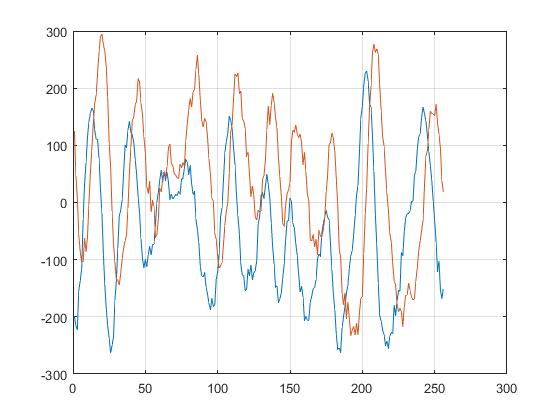
1) When I compare my time domain plot with the plot created by Radar Studio with the plot I created, there seem to be some dissimilarities in the plots. As Radar Studio removes the DC, I want to know how can I remove DC in my own plot.

2) To create FFT output in dBFS, what should I do? Will abs value of (FFT of (Idata+j*Qdata))/ 2^15 ) produce the results as produced by Radar Studio? What should I do to convert the bin frequency to range in meters?
Thank You

