


Hi,
I'm plotting the X and Y points on a plot for detected objects like TI's online mmwave demo visualizer , but instead of only one objects I'm getting more than 4 or more points on my plot. I have created my own plot and I'm plotting those XY points. Is there any scaling i need to apply for my plot? and I'm not getting movement of objects like how in TI's mmwave demo visualizer.
Please look at attached snapshot of my plot.
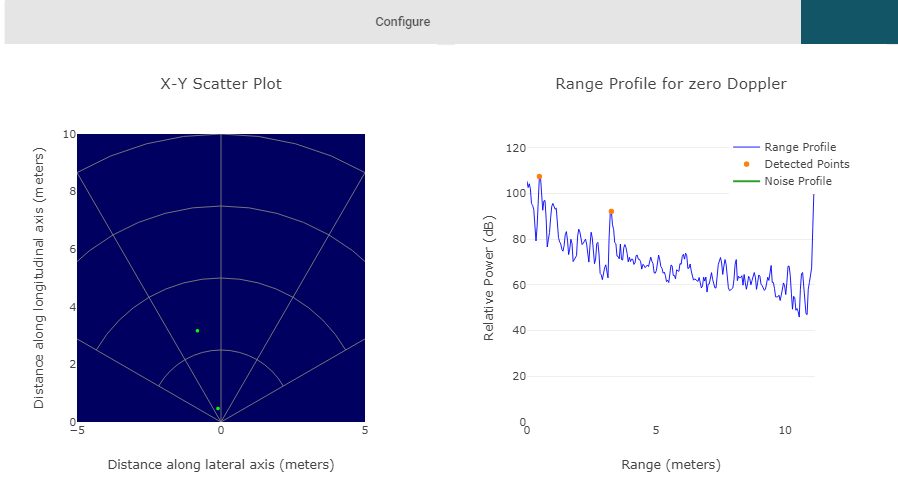
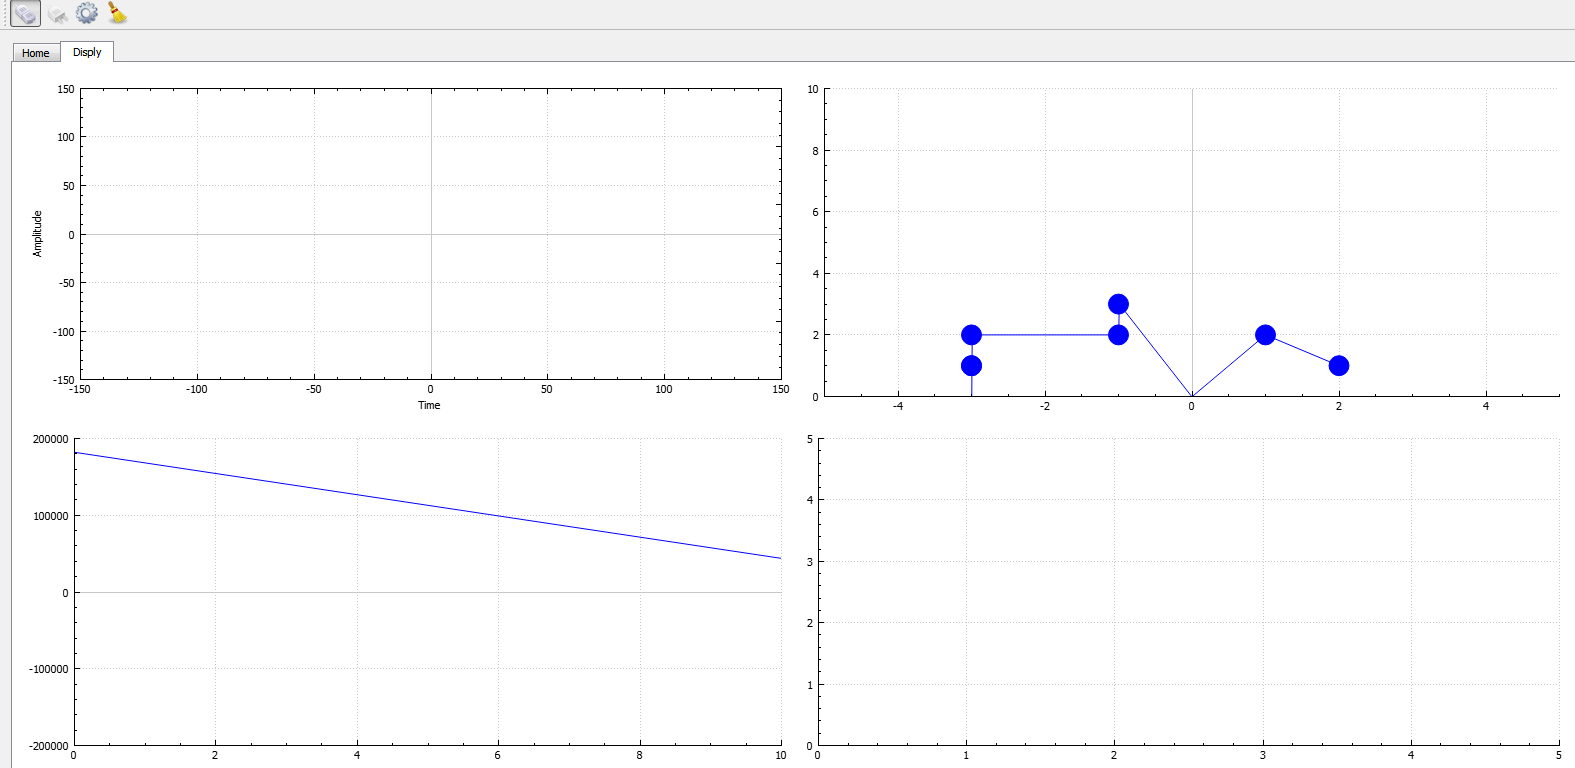
In my plot I'm getting 6 objetcs for single object and in TI's mmwave demo viusalizer I'm getting correct, am I missing any scaling factor? while ploting my data ?
Thanks,
Vinayak
