


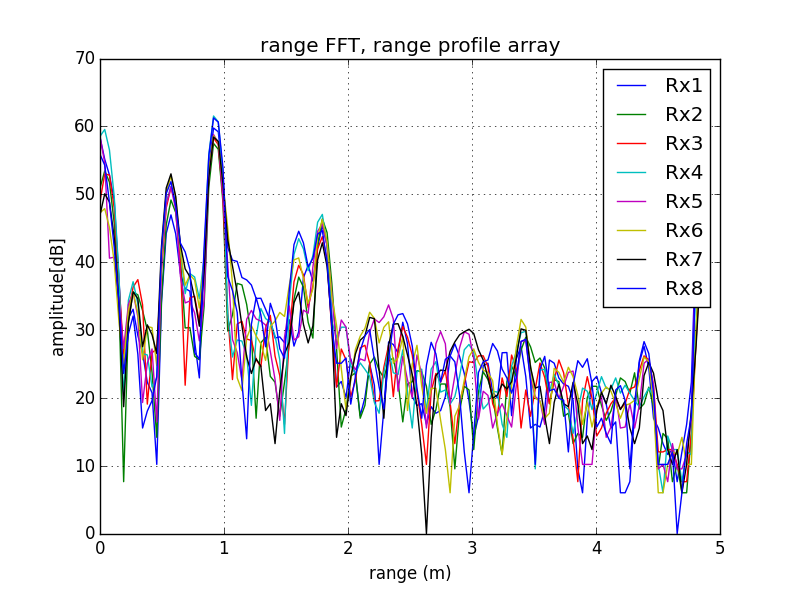
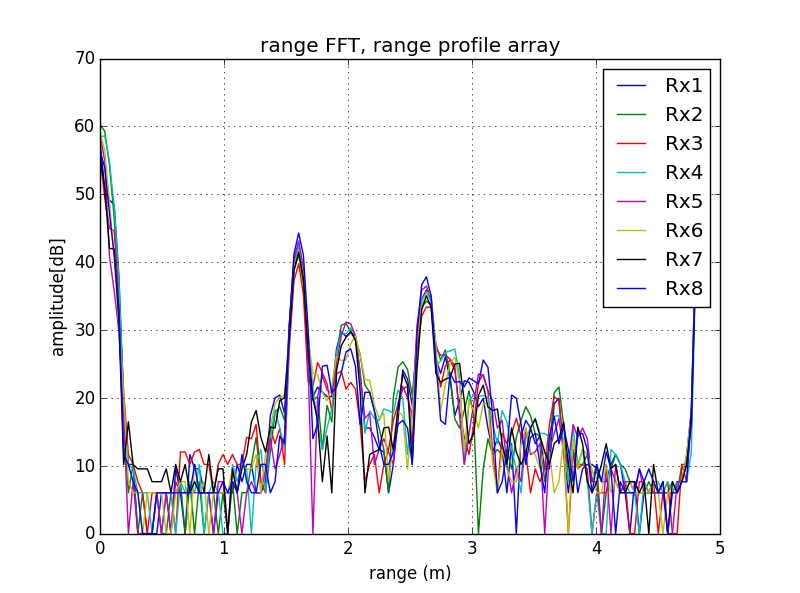
I got the data of range FFT and plot the data per antenna like the graph "range FFT" below:
the mean value of the antenna plotted like "Range profile array (mean by frame)"
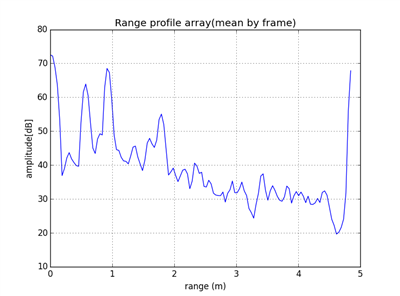

compare the level of "Range profile array (mean by frame)" and "range profile form Uart", the whole shape of the graph is similar but the delta of max and min value is so different.
I have read the reference in file:///C:/ti/mmwave_sdk_01_01_00_02/packages/ti/demo/xwr16xx/mmw/docs/doxygen/html/index.html and know the rangeFFT is 1D-FFT,
rangeProfile is the 0doppler array of 2D-FFT. But i think it should be same value of (peakvalue - noisefloor), anyone can tell me why it is so difference?
or give me a formula to calculate the rangeProfile from 1D-FFT?
Thanks!

