This thread has been locked.

If you have a related question, please click the "Ask a related question" button in the top right corner. The newly created question will be automatically linked to this question.

IWR1443BOOST: LEVEL SENSOR: Radar Studio e how-to have the value of level out of the board

Part Number: IWR1443BOOST
Other Parts Discussed in Thread: IWR1443, TIDEP-0091

Dear All,

I have IWR1443 EVM and DevPack EVM.

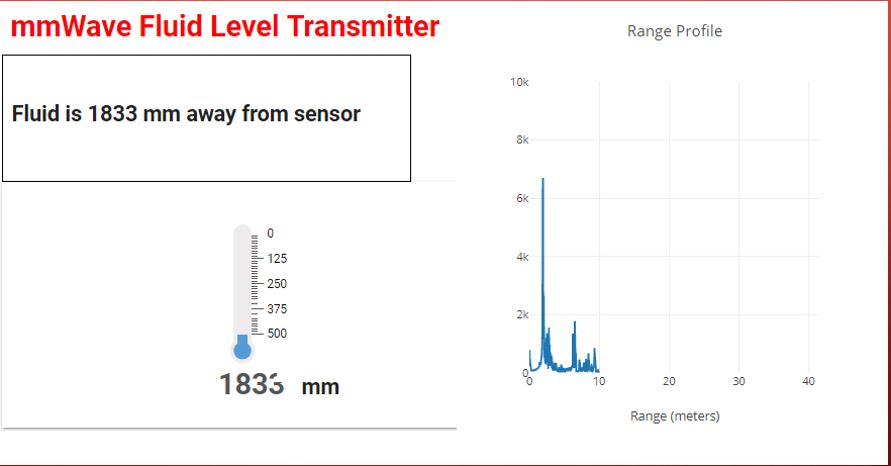
I 'm very interested in the Fluid level application of the radar and it seems that works quite well.

However, currently the information about the level is shown only by using web page https://dev.ti.com/gallery/view/4768107/mmWave_Fluid_Level_Transmitter_1_0_0/

My questions are:

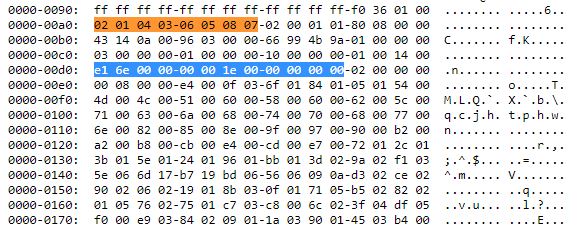
1) Can I have the info about the level in mm available outside the board somewhere in a standard protocol?

2) (this questions is a little bit confused because i'm not an expert in TI devices)
     Can I use some tool (I think Radar Studio is the more suitable one) for configuring the antennas, the transmitted signals, received signals, ect...?

3) This device should work in a low-power application. How can I turn it on/off or in sleep mode and send immediately the level when interrupted?

Sorry again, but I'm more familiar with microcontrollers, where everything is easy and immediate. Here, I found some difficulties.

Many thanks,
Davide

  • Hi Davide,

    The level sensing demo package output data and send out through UART port. If you want to know more details, there's another thread which might help:
    e2e.ti.com/.../2447737

    In addition to UART, the SOC chip also support other formats of data output, for example SPI. Since you are familiar with microcontrollers, you may be interested in the tidep-0091, a design example using iwr1443 with msp432, here's the link:www.ti.com/.../TIDEP-0091, this example output data through SPI from IWR1443 to MSP432 and iwr1443 can be turned on/off by msp432 through GPIO. This should answer your question 1 and 3.

    As for question 2, radar studio is helpful for setting configuration parameters. To be able to collect data, you'll need devPack and TSW1400 for data processing.

    Let me know if you have any questions.

    Regards,
    Michelle
  • Dear Michelle,

    many thanks for your reply. However, it seems that your help generates in me more doubts than before.

    I try to explain me better:

    I have flashed the board with "High Accuracy" prebuilded binaries and my idea is to realize a fluid level sensor.
    Once the board is flashed, I run the web application and the level is visualized on the web.

    Now let's assume that this board should work with a Raspberry Pi, Arduino through the COM port.
    I would like to power on the EVM, power on the Rasberry Pi, send configuration to the EVM (for example the file profile_2de.txt or profile_2db.txt, or any other config custom file) and then receive trough COM PORT the same number I visualize in the Web App, i.e. the fluid level.

    Could you help me with a step-by-step procedure for having this?
    I think that it would be helpful also for other persons in the community.

    Many thanks,
    Davide
  • Hi Davide,

    I understand your setup. In your Rasberry Pi, you can program UART port similar as PC, one for sending configuration at Baud rate 115200 and one for receiving data at Baud rate 921600.

    The data you received has a data structure, more details can be found in this thread: 

    Then you can display the calculated peak value on Raspberry Pi.

    Let me know if you have any question.

    Regards,

    Michelle

  • Dear Michelle,

    many thanks for your kind help. I have carefully read the suggested thread and it is very interesting for my application.

    Ok, now I have understood how and where to find the values in meters in the received data. A simple post processing is needed, but not too much complex.

    Now, the quest moves to how to have that data available. In other words, my difficulties are related to the configuration of the Data COM port in TeraTerm.

    The steps I followed are listed below (please, send me an ACK for each step to be sure that the procedure is correct):

    1) Flashed the EVM with the *.bin files for the application "High Accuracy xWR14xx  ". The files are "xwr12xx_xwr14xx_radarss.bin" and "xwr14xx_high_accuracy_mss.bin".

    2) Power cycle the EVM without jumper SOP2.

    3) Open 2 sessions of TeraTerm: one for Application/User port and one for Data Port (in my case COM4 and COM5, respectively).

    4) Set the ports as follows (No other settings have been made, is it right?):

    5) On the COM4 terminal, I sent exactly the same configuration commands reported in the configuration file "profile_2de.txt", i.e.

    sensorStop

    flushCfg

    dfeDataOutputMode 1
    channelCfg 1 1 0
    adcCfg 2 1
    adcbufCfg 0 1 0 1
    profileCfg 0 77 7 7 212.8 0 0 18.32 1 1024 5000 0 0 40
    chirpCfg 0 0 0 0 0 0 0 1
    frameCfg 0 0 1 0 500 1 0
    calibDcRangeSig 0 -5 5 32
    guiMonitor 1 1 0 0 0 1
    sensorStart

    6) After the last command, the COM5 terminal starts to "move", but the visualized symbols are not the same as discussed in the thread you suggested to read.

    Please, could you help me to understand where is the error?
    For sake of completeness, this is what I see after "SensorStart:

  • Davide,

    The setting of COM port is correct. The data showing up on COM 5 means it's working. The reason you can't see the expected data and all output seems garbled is that the output data is in binary format, not ASCII. You need to save the output and read in a binary format.

    Visualizer uses java code to read the UART output data. Other tools can be used as well. For example matlab. 

    Hope this helps.

    Regards,

    Michelle

  • Dear Michelle,

    I have extracted the Data from the device and visualized. Thanks.

    However, a quite large discrepancy between the received data and the real one is present.

    In the following I show you the measurement setup, web application results and extracted data:

    1) REAL DISTANCE = 1.833mm

    2) FLUID LEVEL VISUALIZER = 1.833 mm (OK!)

    3) EXTRACTED DATA = 1.902mm (WRONG!)

    Qformat = 0x14 -> decimal = 20

    Range est low 16 bits = 6ee1 -> decimal = 28385

    Range est high 16 bits = 001e -> decimal = 30

    DISTANCE FROM DATA = (28385+30*65536)/(2^20)=1902 mm

    Please, could you help me to understand where about 7cm came from?

    Many thanks,

    Davide

  • Michelle,

    probably I have found the solution in the code of the GUI interface "mmWave_Fluid Level Transmitter".

    The code in mmw_HighAccu.js is slighly different in the two interfaces, i.e. High Accuracy Visualizer and Fluid Level transmitter.

    The difference is located in the segment of code written by Akash (I suppose) al line 690 of Fluid Level transmitter:

                  //Akash

                   templateObj.$.ti_widget_plot1.restyle(update, [0]);

                   } else if (Params.use_restyle==2) {

                   templateObj.$.ti_widget_plot1.data[0].x = math.zeros(x_coord.length).valueOf();// [WL: 0;

                   templateObj.$.ti_widget_plot1.data[0].y = x_coord;

                   //templateObj.$.ti_widget_plot1.data[0].marker.color = peakValLog;

                   //templateObj.$.ti_widget_plot1.data[0].marker.color = '#00FF00'; //#1BC81B';

                   var new_x_coord = x_coord - .0696

                   x_coordPrev = ((x_coordPrev)*.8 + (new_x_coord)*.2);

                   var x_coordLast = x_coordPrev * 1000;

                   var title_s = 'Fluid is ' + math.round(x_coordLast*1)/1 + '' + ' mm away from sensor';

                   templateObj.$.ti_widget_plot1.layout.title = title_s;

                   templateObj.$.ti_widget_plot1.redraw();

                   templateObj.$.ti_widget_label_reading.label = title_s;

                   templateObj.$.ti_tile_thermometer1.value = x_coordLast;

                   }


    In bolded font, I have found my 7 cm! You guys have applied a sort or correction factor to the distance. Is it right?

    The quest is now WHY?

    Please, could you confirm or not my conclusions?

    I think that it would be very interesting for the community because I did not find any discussion about this in TI documents.

    Many thanks,
    Davide


  • Davide,

    Your finding is right on. There is always an offset of what radar measures vs. the actual distance. In SDK1.1 mmw demo, a range bias offset cli command is implemented, but it's not available in high accuracy lab (both level sensing and high accuracy lab has the same binary). In mmw demo, the offset is measured and subtracted in mss code but in level sensing it's done in visualizer.

    For your information, the cli commands used in mmw demo is measureRangeBiasAndRxChanPhase and compRangeBiasAndRxChanPhase.

    I think the question from this thread is solved. Please confirm. Feel free to ask question if there's any.

    Regards,
    Michelle