


Other Parts Discussed in Thread: IWR1443, AWR1642, AWR1443
Hello,
I have been using the vital sign lab for a long time. Since I can get the complex range profile by the Matlab code, I got the range profile variations in time by plotting a graph like a waterfall. Indeed, the Doppler-range map is obtained. I have realized that the range waterfall shows an increment in the peak of the range profile over time (fig. 1). The Doppler-range map also does not have any Doppler components over some specific ranges. These specific ranges also varying every time the radar starts sensing (fig. 2). what are the reasons for these observations.
Thanks in advance,
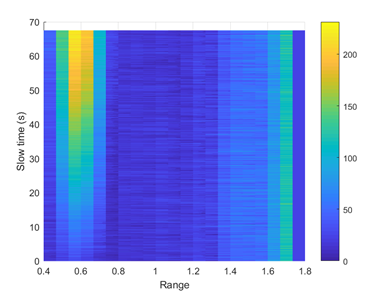
(fig. 1)
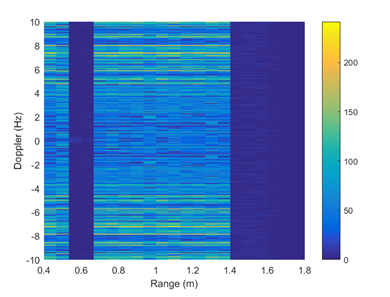
(fig. 2)


