This thread has been locked.

If you have a related question, please click the "Ask a related question" button in the top right corner. The newly created question will be automatically linked to this question.

IWR1642BOOST: mmWave Visualizer - Retrieving range at plot windows and the CLI

Part Number: IWR1642BOOST


Hi,

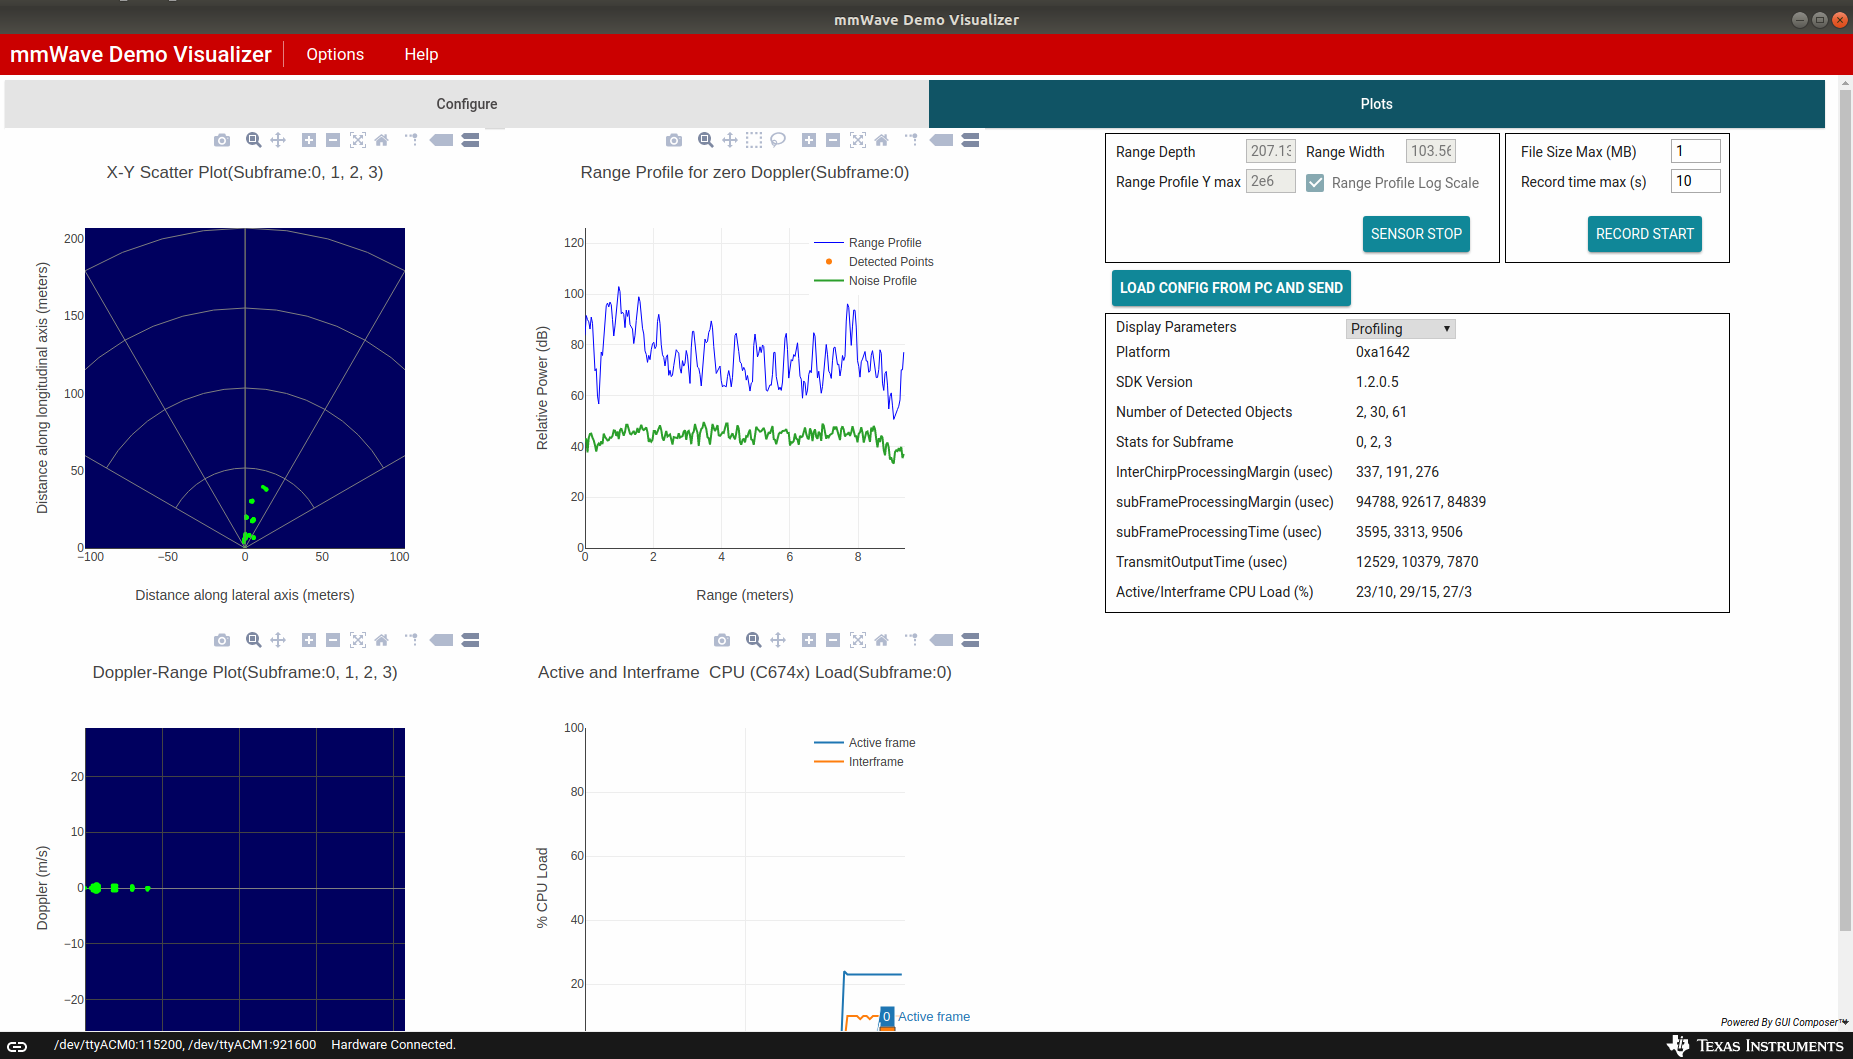
I am using the mmWave Demo Visualizer with the corresponding demo application from the SDK v1.2.0. The chirp configuration I've loaded through the CLI is the advanced one having four subframes, with the ultimate objective of measuring the range of an object from the BoosterPack, all the way from 1m to ~35m. Since I'm not interested in the angle or the velocity of the object, I'm using the X-Y scatter plot and the range profile for zero doppler plots.

I am stuck at being unable to view the range profile for zero doppler for subframes 1, 2 and 3. I need this because the peaks corresponding to the object are, for some reason, not being detected when the object is at a long range (>10m). In those cases, the object does not feature in either plot. That described, the following are my questions:

  1. I'm unable to understand appropriately from the SDK User Guide how to set the peak detection threshold in the multiObjBeamForming and the cfarCfg since I've been unable to have those peaks (clearly visible in the range profile for zero doppler) detected (in the X-Y scatter plot). How do I set this? [This means I could view those objects on the X-Y scatter plot]
  2. Why does the Demo Visualizer plot the range profile for zero doppler only for subframe #0? Even when I hardcode the subframe number to 1, 2 or 3 within the mmWave.js, the data corresponding to subframes 1, 2 and 3 are unavailable. Why's that? [This means I could view those objects on the range profile at zero doppler]
  3. Would there be a way to retrieve an array containing the range of detected objects within the MSS/DSS firmware and expose that over the CLI similar to the range bias computation? I've been browsing the forum and the MSS/DSS source codes, but I didn't yet get a chance to dig in - what would be the most appropriate way to do that? [This means I could view those objects at the CLI once the peaks get detected]

Thanks,

Anirudh

  • Hi Anirudh,

    Let me try to understand your questions.
    1. You mean you can see the target peak in Range profile in zero doppler figure, but it can not be detected by the CFAR? You can try to reduce the CFAR threshold to get more detected points. The CFAR function is used to find peak in Range-doppler heatmap. You should make sure this target can be found in the CFAR output. You can change the "Detection threshold" in cfarcfg command in CLI cfg file.
    Also, clutterRemoval will influence the detected result of the statics object, please make sure you have already disable this function.

    2.Could you please check what the C code do to save the range profile data? If it was limited by C code. You can try to set the interested chirp you want to display on GUI as Chirp 1. Then you can see the plot. Or you can write a matlab script to capture data from UART and plot the figure.

    3.You can modify the C code and send out the information you are interested.

    This is a useful document you can refer to better understand the SDK code.
    Path: file:///C:/ti/mmwave_sdk_01_02_00_05/packages/ti/demo/xwr16xx/mmw/docs/doxygen/html/index.html

    If you have any more questions, please let me know. Thanks.

    Regards,
    Wesley
  • Hi, Wesley,

    Thanks very much for the answers! I'm adding my comments below.

    1. I'm sure there is a peak corresponding to the physical object, but it wasn't being detected as a peak, so it didn't feature in the X-Y scatter plot continuously. And the subframes 1, 2, and 3 weren't displayed on the range profile for zero doppler, so I couldn't confirm if the peak existed. I'll tinker with the CFAR configuration since that should theoretically affect the peak detection. I'd enabled static clutter removal and I'd ensured that the object continuously moves radially so that I'm able to see a peak at a continuously increasing range.

    2. I'm using the mmWave Demo Visualizer - it only displays chirp 0 and I've tried hardcoding that to chirp 1, but I think I'm missing something. Is the documentation for these visualizers available?

    3. Okay, so this means the MSS would be able to access the range profile - am I understanding correctly?

    Thanks,

    Anirudh
  • Hi Anirudh,

    Can you please try to use only one profile to config the device. Then you can see the Range profile in zero doppler figure and detected result through GUI. You can identify if this issue is cause by CFAR or static clutter removal.
    The Data send from device is process by DSS and MSS, you can modify the C code to make it send any data you want.

    Regards,
    Wesley
  • Hi, Wesley,

    I've run the single-profile configurations - those seem to work fine with and without static clutter removal, ceteris paribus. Besides, I've tried the advanced configuration with and without static clutter removal, and the detection behaviour is identical - so it must be the CFAR tuning and nothing else.

    I'm currently expanding the comments in the source code for the demo visualizer to understand the plots better. It would've been easier to diagnose this issue if all subframes' range profile at zero doppler are plotted. Currently, advanced configurations have this graph only for the first plot-enabled subframe.

    Also, I'm planning to add a CLI command to retrieve a range array - that should probably settle everything.

    Thanks again,

    Anirudh