This thread has been locked.

If you have a related question, please click the "Ask a related question" button in the top right corner. The newly created question will be automatically linked to this question.

IWR1443BOOST: How to read the data file of mmWave Demo Visializer ?

Part Number: IWR1443BOOST

Hi,

Please teach me how to read the data file of mmWave Demo Visializer.

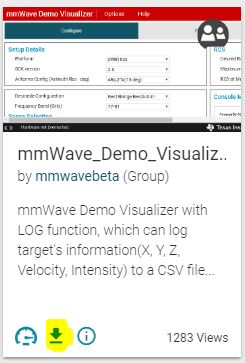
I use mmWave Demo Visializer,Online.
<dev.ti.com/.../>

Plots Tab,when I push "Recoard Start ",visializer made a data file.
(xwr14xx_processed_stream_.....dat )

But I cann't read this file as text .
It was not good to change encode variously.

Where is the special tool for reading this binary file?

Regards,

user5205609

  • Hi,

    The data format is same as the data transmit from UART from mmWave Demo.

    To process the recorded data: See the Visualizer User's Guide, section 4.4, to understand what the data contains. Information on the actual data is available in the doxygen - <mmWave_SDK_Install_DIR>\packages\ti\demo\xwr16xx\mmw\docs\doxygen\html\index.html.
    User's Guide: www.ti.com/.../swru529a.pdf

    There is a demo in beta that saves the recorded data to a human readable CSV file - you can read the code and understand the data conversion process:
    mmWave visualizer with the LOG function: dev.ti.com/.../

    The data saved in this file is the exact same data and format that is transmitted out of the mmWave device over the DATA_port. Users should see the mmWave demo doxygen in the mmWave SDK package to understand the format of the data and how to parse it.

    Regards,
    Wesley
  • Hi,

    Thank you very much.

    Is there the beta version of "ti-widget-streamsaver" which can be accessed from the user's guide
    <www.dev.ti.com/.../index.html Widget-streamsaver>?

    I can not access it because I caught up with company security, but are there offline tools?
    We can access <https://www.dev.ti.com/>, so select "GUI" from here
    and go to <https://www.dev.ti.com/gc> , a choices and input boxes come up.
    What should I do next from here?

    If this is the case,
    should I analyze the data format and have to build my own tool ,
    in C or python?

    Regards,
    user5205609
  • Hi,

    Is that possible access to ti-gallery? You can search "mmWave visualizer with the LOG" in ti-gallery. Link:

    Also, you can download the offline version through ti-gallery.

    Thanks.

  • Hi,

    Thank you very match,but the installer GUI is not correct.

    I can not scroll the GUI at "I Agree".

    I can not change the size of this screen.

    I changed my Windows10(64bit)  settings and display resolution, I can not  be able to see the part of the radio button.

  • Hi,

    Please change your resolution setting of your PC and try again.

    If it doesn't work, please try another PC. Thanks.

    Regards,

    Wesley

  • Hi,

    Thank you.

    It was not possible to display the radio button by changing the resolution
    in Windows or adjusting the hardware.
    However, when I repeatedly click the arrow key and the mouse click several times
    in the lower part of the screen, I was able to transition to the next screen by chance.
    I happened to solve this problem.


    Regards,
    user5205609