Other Parts Discussed in Thread: AWR1642
I used AWR1642 with DCA1000 to capture the raw data and analyze on Matlab.
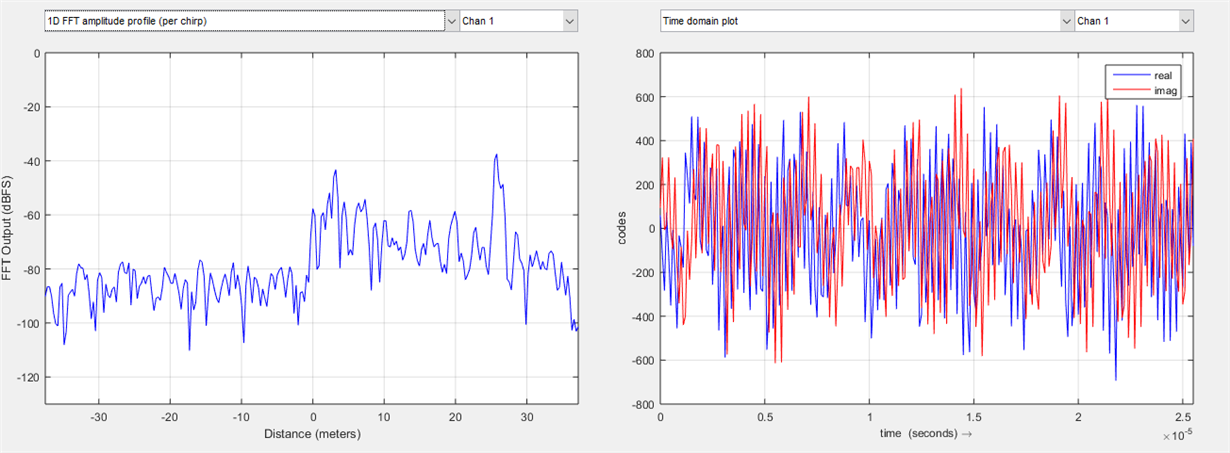
I used function "cumsum" to get the time domain data. But the result (figure1) is different from figure2 generated by mmWave studio.
I just plot only one chirp, one frame, one channel in the graph.
Can someone tell me what's going on? Thanks a lot!


