This thread has been locked.

If you have a related question, please click the "Ask a related question" button in the top right corner. The newly created question will be automatically linked to this question.

AWR1642: small phase

Part Number: AWR1642

Hi, 

I recently was working with the phase of the received complex range profile by using vital sign demo. I realized that there is a decaying slope in the phase of the reflected signal. I try to run tests in an antenna chamber to see the phase slope for a target which does not move with respect to the radar. I captured the phase variation like below:

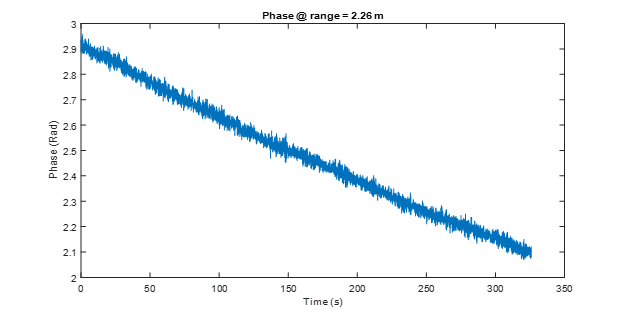
As I said, this is for a single stationary target. I would expect to get a noisy phase with almost zero mean but it is not like that. Do you have any idea why the phase decreasing very slowly? I guess it is because of the phase noise. Any idea? 

Best, 

Mostafa 

  • We are checking with our characterization team if we have similar measurement

    thank you
    Cesar
  • Hi,

    I discussed with our team and we think that you are measuring the phase in the same chirp. This phase will be linear since it wraps around 360deg.

    If you measure that phase at the beginning of each chirp you should be able to see the phase with almost zero mean you are expecting

    thank you
    Cesar
  • Can I have your email to send you a snippet of my code to point out possible problems? 

    Best,

    Mostafa 

  • The figure I plotted contains the phase samples of different chirps but at a specific range bin. At that range I have a metallic plate. Your answer did not help me to figure out the reason. Because the slope of the phase is very small, so in the presence a moving target it can not be recognized. It can be seen for a perfect staionary object.

    I recommend you to run the vital sign demo and capture the complex values of the range profile. Then, take the phase of the samples and look at a particular range bin phase at which you have a staionary reflector. Collect the phases from different chirps and put them into a vector. Then plot the phase samples. You will get similar phase variation as mine. Any more ideas?

    Best,
    Mostafa
  • Hello Mostafa,

    Let me consult with the Vital Signs expert and get back with you.

    I have also sent you a friend request. You should be able to share your code with me if you accept.

    Regards,

    Adrian
  • Hi Adrian,

    Thank you for the friend request but I could not send you a private message. The error says:

    You don't have permission to access "e2e.ti.com/.../conversation on this server.
  • Hello Mostafa,

    So, we are not supposed to debug customer code so it is not possible for me to test your code. Can you provide us with a detailed description of you test setup, including block diagrams, etc if possible? I can discuss with our characterization team to see if we have run any similar tests in the past and we can see how your results correlate.

    Regards,

    Adrian
  • Hello Mostafa,

    This behavior is likely due to the self-heating of the device. There is a very long time constant to the thermal rise, and as the device warms up, there is a change in the group delay of the active circuits in the TX-to-RX path. This can lead to the observed shift in the object phase. If you wait long enough, this would stabilize, but this may take many minutes.

    Regards,

    Brian