This thread has been locked.

If you have a related question, please click the "Ask a related question" button in the top right corner. The newly created question will be automatically linked to this question.

IWR1443BOOST: object euclidean range ( (sqrt(x*x+y*y+z*z)) ) not equal to range profile range

Part Number: IWR1443BOOST

Hello,

this is a question that has already been asked by other users but we are not fully satisfied by the reply.

I am just running the mmwavedemo visualizer demo. I am running the attached profile configuration. 

/cfs-file/__key/communityserver-discussions-components-files/1023/profile_5F00_range29.65.cfg.

In this profile in which we have 1024 bins and a  rangeIdxToMeters of 0.0359095.

This is the object values for a specific frame:

object.RangeIdx:  1, 3, 719, 716

object.X: -0.012000, 0.088000, -7.27100, -3.21900

object.Y: 0.0330, 0.0620, 24.809, 25.543

object.Z (all equal to 0)

object.euclidean  (sqrt(x*x+y*y+z*z)): 0.03511, 0.10764, 25.8525, 25.7450

We were comparing the range profile with the object euclidean range. This euclidean value is very similar to the value read on the range profile for short ranges. 

For example:

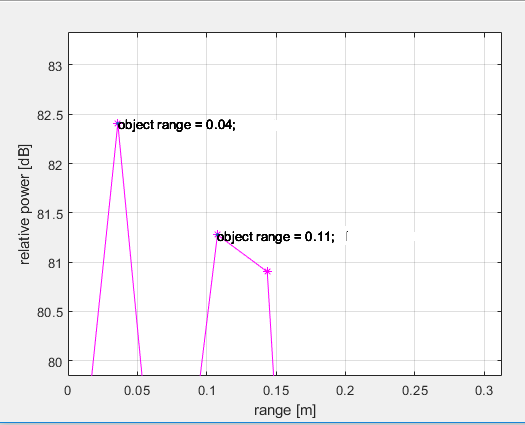
the sqrt(x*x+y*y+z*z) object range corresponds to what we see on the x-axis of the range profile  (where the power peak is located), for both objects (0.035 and 0.107 euclidean range objects).

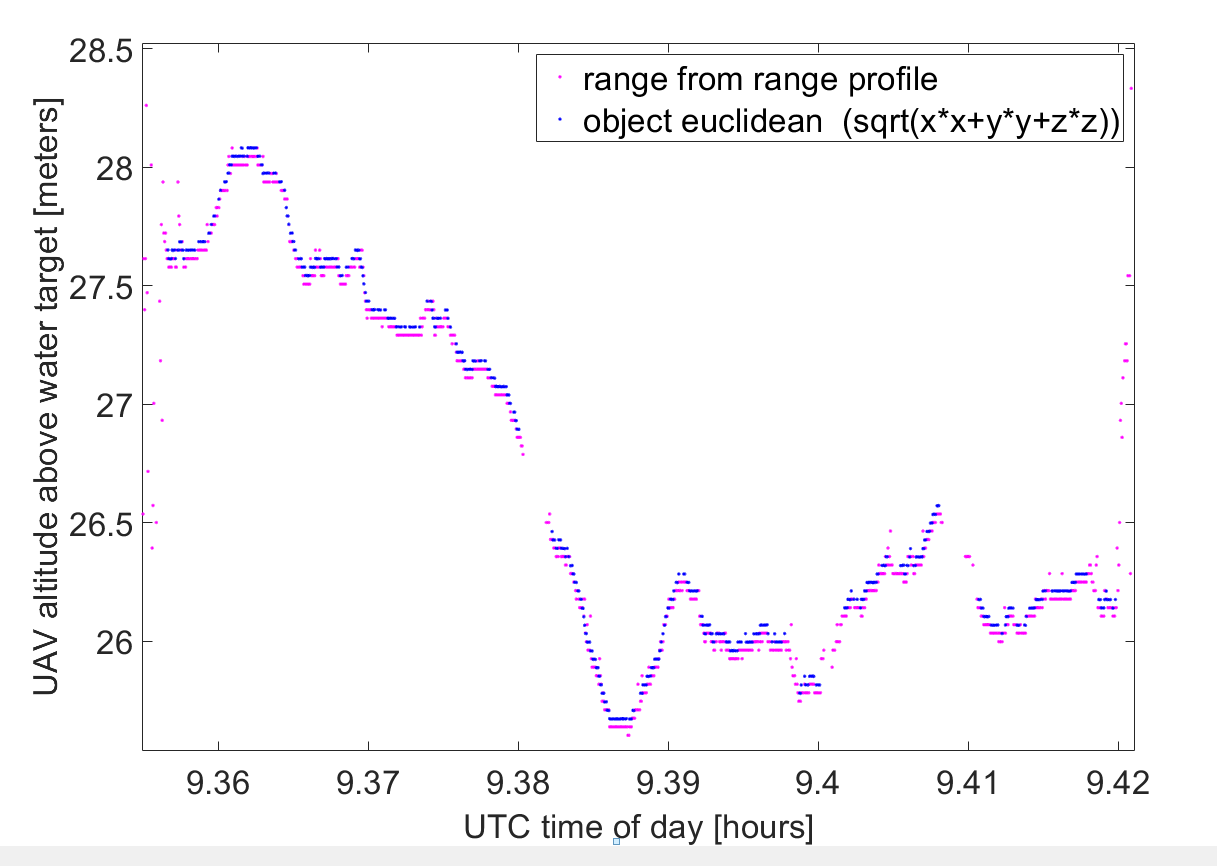
However, for long ranges, there is a discrepancy between the range profile and the object euclidean distance.

In this case there are around 0.0336 m difference between the object euclidean sqrt(x*x+y*y+z*z) range and x-axis value of the range profile bin (where the power peak is located),  for both objects (25.745 and 25.852 euclidean range objects).

So in few words: the difference, between ( (sqrt(x*x+y*y+z*z)) )  and the range profile x-axis value, increases directly proportional to the range value. It always looks like the offset,  between (sqrt(x*x+y*y+z*z) and range profile x-value, can be computed with  offset= 4.680149319700316e-05* range, which leads to a difference of ca. 0.0336 m for the range bin nr 719.

Can anyone explain why we have this discrepancy?

  • Hi,

    Just to confirm a few things, the 2nd graph label is for the measured peak range or calculated from xyz?

    I recalculated corresponding to the index, here's the table:

    index calc fromxyz peak range difference

    index calc fromxyz peak range difference
    1 0.03511 0.0359096 -0.000799598
    3 0.010746 0.1077288 -0.096982795
    716 25.74503467 25.711272 0.033762345
    719 25.85254189 25.819001 0.033540771

    Your question is why at index 719, there is 0.0335m difference, correct?

    Do you have any number in between index 3 and 716 to show it's a proportional change of offset? 

    Regards,

    Michelle

  • We found the discrepancy you are observing is because of the difference in the way we calculate the range from range index inside the target code (i.e code in the SoC) in order to compute x,y,z (which are based on R, theta, phi but they mutually satisfy R^2 = x^2 + y^2 + z^2) and the way we calculate the in the visualizer. In particular, the discrepancy is caused by the quantization of "freqSlopeConst" in the profile configuration that is used to calculate the range step. The formula in the visualizer (.js file) is as follows, which is the number you are using in conjunction with the target reported rangeIdx to do the range calculation off-line:

    P.dataPath[idx].rangeIdxToMeters = 300 * P.profileCfg[profileCfgIdx].digOutSampleRate /
    (2 * P.profileCfg[profileCfgIdx].freqSlopeConst * 1e3 * P.dataPath[idx].numRangeBins);

    Above uses the freqSlopeConst from the profile configuration in your .cfg file (which is 35 MHz/us). But inside the code, it first gets quantized to a different format (that is compatible with the mmwavelink layer, which takes in steps of 48.279 kHz/uS) during the cli parsing C code as follows:

    /* Translate from MHz/us to [1 LSB = (3.6e6 * 900) / 2^26 = 48.279 kHz/uS] units of mmwavelink format */
    profileCfg.freqSlopeConst = (int16_t)(atof(argv[8]) * (1U << 26) / (3.6e3 * 900.0));

    Note the cast to 16-bit (and it is not even rounded, it is truncated). Then, when the time comes to compute x,y,z, we use the rangeResolution as multiplier, this rangeResolution is computed during profile parsing as follows in the C code:

    dataPathObj->rangeResolution = MMWDEMO_SPEED_OF_LIGHT_IN_METERS_PER_SEC * profileCfg.digOutSampleRate * 1e3 /
    (2 * profileCfg.freqSlopeConst * ((3.6*1e3*900)/(1U << 26)) * 1e12 * dataPathObj->numRangeBins);

    Note the reverse translation of the freqSlopeConst. This above value is what gets used to calculate the range and subsequently x,y,z in the C code. When I plug your profile configuration numbers, I get the range step to be 0.0359 m and if you use this with the reported rangeIdx and compare with your euclidean calculation, you will see the error is not range dependent.

    The solution for this is that the visualizer needs to be fixed to imitate the code because that is what the actual RF will be configured to (the 48.279 KHz/uS jumps). In order to improve accuracy, we may do a rounding instead of truncation to 16-bit but this aspect is independent of the problem, it is only about honoring as closely the .cfg as possible, not about visualizer not using what was actually configured in the RF h/w.

    So for now, you should assume the true value of rangeIdxToMeters to be 0.0359 m and if you change .cfg, then recalculate according to the C code quoted above (or you can change C code to stream out the rangeResolution variable in some appropriate Q format or float for convenience). We will take action on fixing the problem.

    Thanks for you diligence on reporting the problem in such detail.
  • Firstly, thanks a lot for having understood the question, it was not easy.

    I think that in your computation there is a mistake at index 3. Calc from xyz is   0.10764 (10 times higher than yours), thus the difference with respect to the peak range is very small at those small ranges.

    THe 2nd graph  label shows the object euclidean range (computed from x,y,z). E.g. object range=25.74503467=ca. 25.75. THis point with label is  at the rangeIdx location of the object to show the discrepancy between peak range and calc from x,y,z.

    Another number:

    object.X :-4.0450, object.Y=7.0060, object.euclidean=8.0898739,  object.rangeIDX=225

    peak range=  8.0796374

    difference=0.010.

    My experimental formula: offset (difference)= 4.680149319700316e-05* rangeIDX=4.680149319700316e-05*225=0.010.

    My main concern is that we make a mistake when we compute the rangeIdxToMeters  with the formula:. 

    rangeIdxToMeters = speed_of_light * sampleRate / (2 * freqSlope * numrangebins);

    From the profileconfig, which I previosly attached as a file,:

    profileCfg 0 77 2929 7 114.29 0 0 35 1 912 8580 0 0 30, I computed  

    sampleRate =8580000, freqSlope =3.500000000000000e+13, numrangebins=1024, speed_of_light=300000000

    We find rangeIdxToMeters=0.035909. If this rangeIdxToMeters was a bit higher,  ca. 0.035953, then the range x,y,z and  peak range would be very similar. 

    Is there an approximation in the formula you use to compute rangeIdxToMeters that is affecting results?

  • Sorry, I did not see your 2nd reply while I was trying to formulate my own reply.
    However, it looks like that the formula "rangeIdxToMeters = speed_of_light * sampleRate / (2 * freqSlope * numrangebins)",which I was seriously suspecting of in my reply, is the real issue.
    So congrats to both, we came to the same conclusions. Thanks a lot!
  • Dear Piyush,

    I was trying to work with the new numbers you provided.

    Just to be sure:

    you said I should use a rangeIdxToMeters =0.0359, while the formula of .js gives a rangeIdxToMeters =0.035909.

    But should I correct my object euclidean range or the range profile itself?

    Because the formula in the .js file is used to compute the range profile rangeIdxToMeters , not x,y,z. If I use

    rangeIdxToMeters =0.0359 instead of 0.035909 in computing the range profile I do not solve the issue.

    I just need to know if it is the range profile or the object euclidean distance to be corrected, because I end up with graphs as the one below

    in which there is a clear offsets between the two measurements and the offset increases with range. 

  • Sorry, I should have expressed the true calculated rangeIdxToMeters (emulating the C code) in higher precision, the Matlab default in display is 4 digits (even though using more for calculations) and I just wrote that not looking at your numbers when I saw agreement at higher range. Anyway below are the calculations in Matlab:

    >> floor(35*2^26/(3.6e3*900)) [floor to emulate (int16)(..) of C code]

    ans =

    724

    >> 3e8 * 8580.0000000 * 1e3 / (2 * 724 * (3.6e3*900)/2^26 * 1e12 * 1024) <--- using 724 from above to calculate the true rangeIdxToMeters (what is called as rangeResolution in the C code)

    ans =

    0.0360 <--- Matlab default display precision is "short" or 4 digits after decimal

    >> ans*[1 3 719 716]

    ans =

    0.0360 0.1079 25.8526 25.7447

    >> format long <--- expressing in longer format, showing true rangeIdxToMeters to be the first value below.
    >> ans

    ans =

    0.035956292203806 0.107868876611418 25.852574094536525 25.744705217925105

    >> ans - [0.03511 0.10764 25.8525 25.7450] <--- difference between true values and what you compute as euclidean

    ans =

    1.0e-03 *

    0.846292203806012 0.228876611418044 0.074094536525848 -0.294782074895750

    >>
    So no range dependency.
    So everything I said in previous post holds (just I didn't publish the true value with enough precision), the fix will be done in visualizer to emulate the C code calculations running on the target for the reason I explained in my previous post.