


Hi,
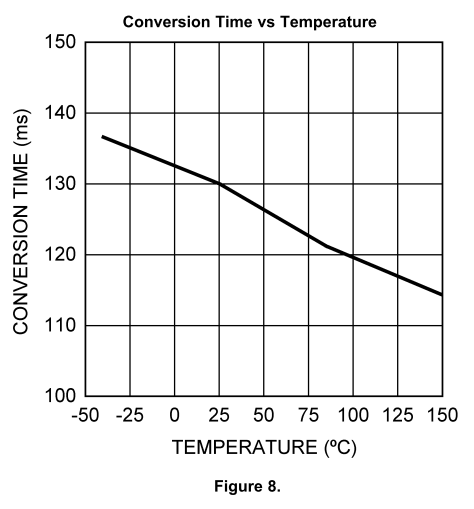
The graph for "conversion time vs temperature" is mentioned in LM95071 data sheet, so could you please tell me how the conversion time is measured ?
For example, they are the sample number per each temperature, the serial clock period, the process condition and so on.
In addition, could you please provide that graph in the worst case(the conversion time is 228ms.) ?
Best regards,
Kato

