This thread has been locked.

If you have a related question, please click the "Ask a related question" button in the top right corner. The newly created question will be automatically linked to this question.

PGA460: PGA460 GUI current version bug

Part Number: PGA460

I just uploaded my PGA460 GUI version to the latest one right now (1.0.1.7). I have seen a couple of bugs on the Threshold tab and on TVG tab.

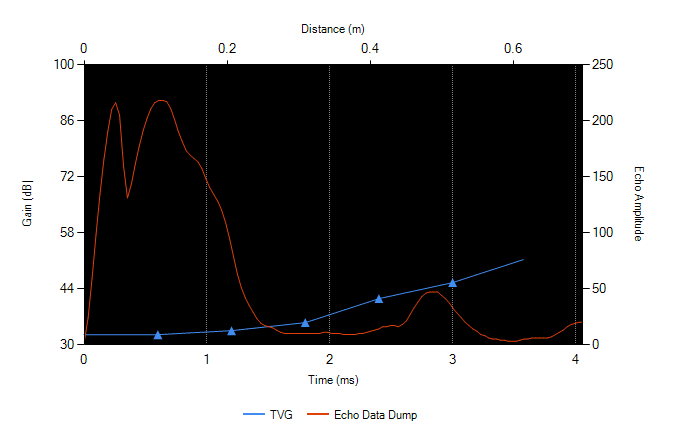
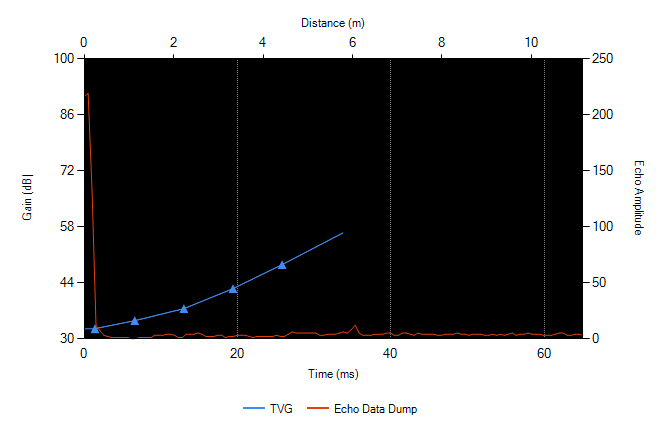
If you change the record time length to detect more or less distance, and hit the START button on the Data Monitor tab, in previous version those charts were updated to reach the distance and time used by the new record time. In this version this does not happen. You still get the 2.8 distance.

Could you please update this?

Besides that, could be possible to load curves in the Data Monitor tab? I would want to load a curve there to allow me to move the cursor over the threshold so I get the distance in the cutting point.

  • Hi Pablo,

    I do see that the Threshold and TVG pages' secondary x-axis (distance) does not properly update when the record length is changed. I will update the GUI to fix this bug in release 1.0.1.8 of the GUI, which is targeted to be available before the end of the month.

    I will also add the ability to import echo data dump plots into the Data Monitor tab. Alternatively, I can add the cursors to the Threshold and TVG pages as well if preferred.
  • Thank you Akeem.

    About cursors/Curve loading, wherever it is easier for you. 

  • Hi Akeem,

    I have seen that yo have uploaded a new GUI version. I am afraid that it keeps with the old bug though. Can you check? Time axis is stuck for 2.8 meters.
    Besides you didn't add the cursor on the threshold tab.

    If you need me to test anything else, just tell me and I will try to give you some feedback.
  • Hi Pablo,

    GUI version 1.0.1.8's TVG and Threshold charts should be updating properly. I checked both for the minimum and maximum time cases as follows:

    Minimum Range where Record Length = 4.096ms Maximum Range where Record Length = 65.536ms

     =

    Are you able to replicate these charts? What settings are you using? I can try to replicate your error if you send me your memory map and EDD data files you are attempting to load into the TVG and/or threshold pages.

    I did not add the cursors to these pages on this update. Instead, I am working to merge the threshold and time varying gain controls onto a single page, and use only one chart (the Data Monitor chart) rather than three separate charts to depict the configuration. This will reduce the amount of back-and-forth toggling between the various setting pages.

  • Hi Akeem,

    the problem seems to occur when you try to configure 0.702 meters length (record time length  4096). It adjuts the chart to 1.4 meters.

    Other distances seem to work fine. 

    Good idea about joining together TVG and threshold!

    EDIT: It seems that distance is adjusted with threshold time length. I got it decreased to 0.5 meters. Well, I think that is ok. I can adjust threshold level to fill all range.

    TVG just go down to 2 meters in distance axis with all times set to 100 and 0.5 (0.4 and half a block more) with time axis.

  • Hi Pablo,
    Just as an FYI: I am have released GUI version 1.0.1.9, which will include a cursors tab for the threshold page. This update should be available online by Monday after the TI servers refresh over the weekend.