Other Parts Discussed in Thread: IWR1443, IWR1642, UNIFLASH
Hi I'm trying to do some very basic tests with my IWR1443 / DCA1000 and the data I'm getting from the radar doesn’t seem to be very good quality.
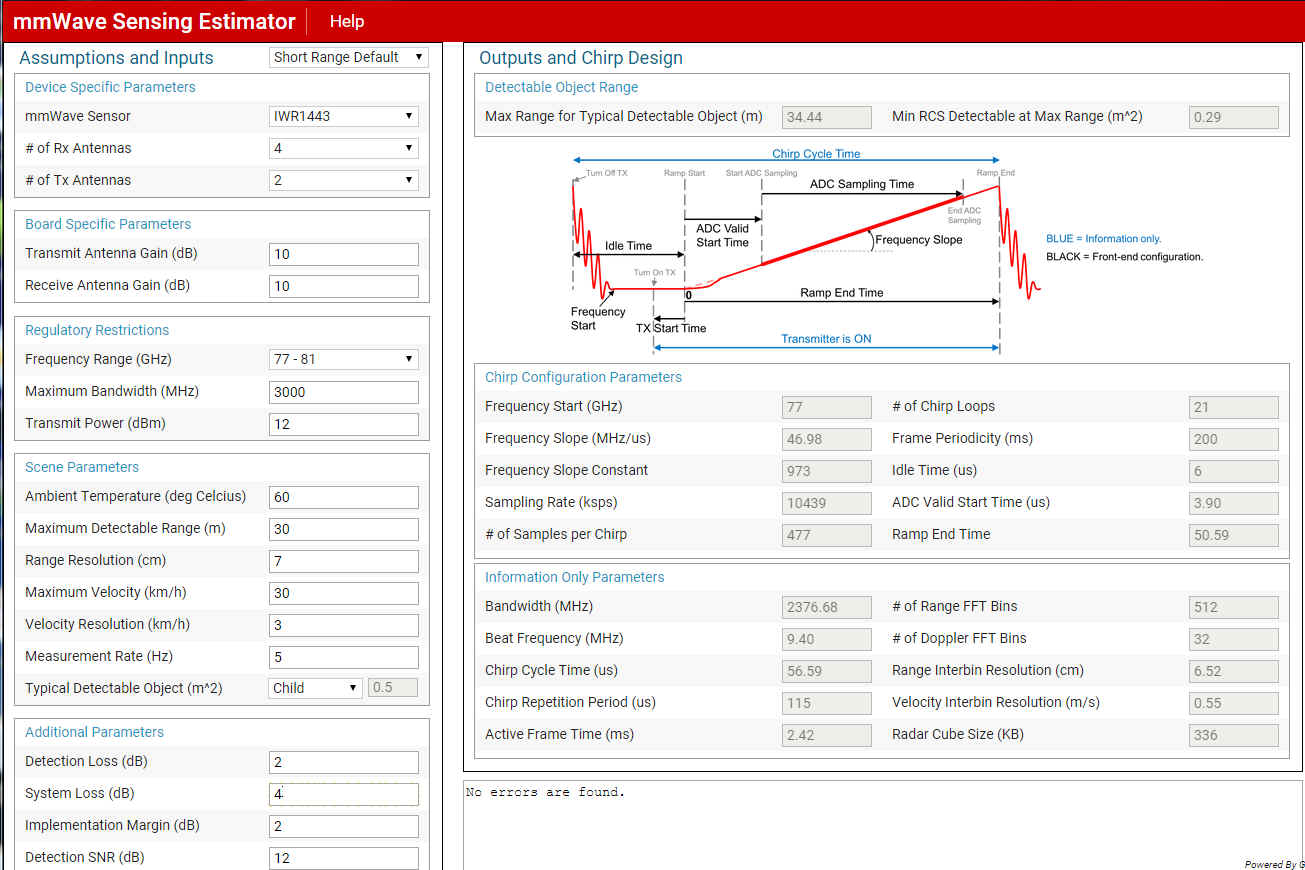
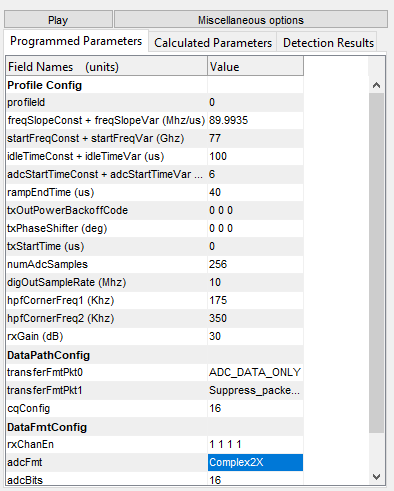
I'm interested in a shorter range application so I've increased the chip frequency slope and decreased the ramp end time. The following are my programmed parameters.
The data was recorded indoors. I have a flat metal plate that I held in front of myself. And walked toward / away from the radar. The space is somewhat cluttered but there are no items that move in the office e.g. fans.
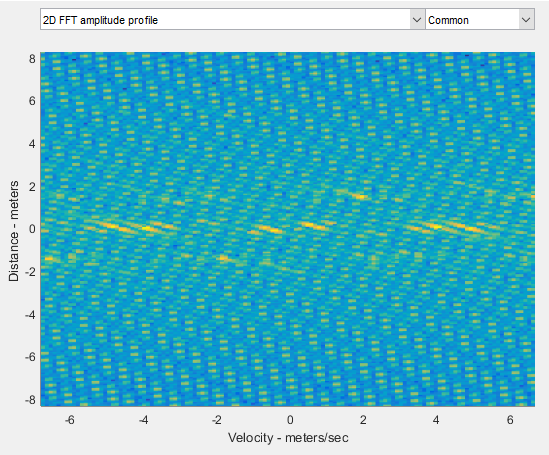
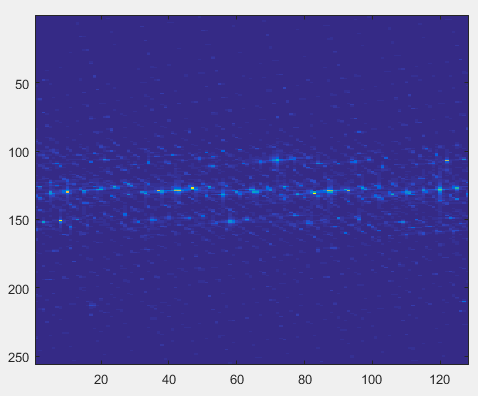
The following is the range doppler map of the first frame. Note there's nothing moving in front of the radar. The "shape" of the range doppler map looks odd to me. I would expect a clutter ridge to run from 0 range to positive range, instead it seems as if there is a clutter ridge that runs along . I've taken these screenshots from mmWave Studio so I don’t think this isn't an issue with the IQ matrix being transposed.
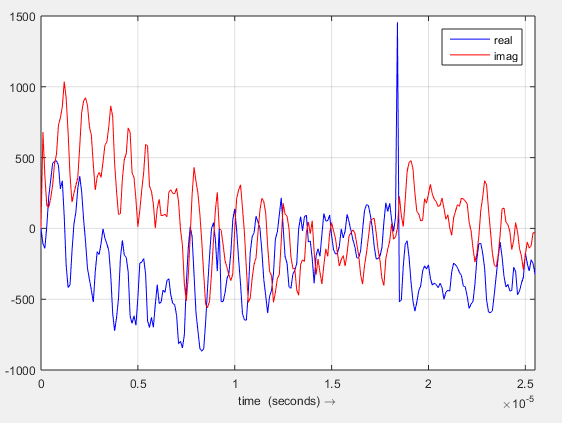
 I also noticed that there are some large spikes in the adc samples (see approx 1.8e-5 s below).
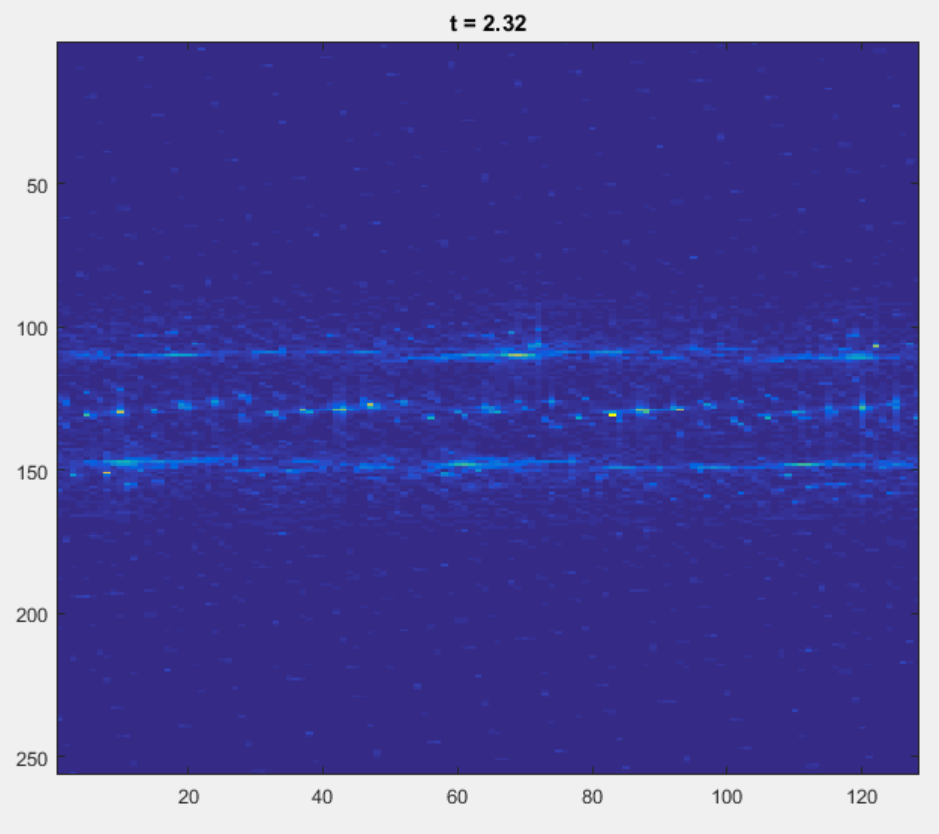
If I replace these spikes with the last valid sample (as determined by a threshold) I get a cleaner looking range doppler map but its still odd looking since the clutter ridge extends across the doppler dimension. I've tried applying a Hanning window across the Doppler dimension but that doesn’t have an appreciable effect on "tightening" the "Doppler clutter ridge"
When I play the frames back I can see what appears to be my plate moving back and forth in the range dimension. The following map shows the plate(see the line horizontal line around range bin ~110) but the is spread across the Doppler dimension.
So my questions are as follows
- Are the spikes in the ADC data expected or indicative of something wrong with my configuration of the radar?
- Why do I have a clutter ridge that lies along the Doppler dimension of my range doppler map? And why is my target energy not better concentrated in the doppler dimension?
- Why do I get so much energy in the range image bands (negative frequencies ). I receive the data in the complex2x format so I would assume that this wouldn’t be the case. Does this possibly have something to do with ambiguous returns (returns from previous chirps)
Thanks,
John