Because of the holidays, TI E2E™ design support forum responses will be delayed from Dec. 25 through Jan. 2. Thank you for your patience.

This thread has been locked.

If you have a related question, please click the "Ask a related question" button in the top right corner. The newly created question will be automatically linked to this question.

AWR1642: Real baseband v.s complex baseband

Part Number: AWR1642

Hi,

I have couple questions about document "SPYY007 Figure 4 & Figure 6".

1. SPYY007 Figure 4a shows the TX ramping frequency, why there are 2 frequency ramping direction ? Or it means there is a LO(TX) harmonic also reflected at the opposide of DC ?

2. SPYY007 Figure 4b shows the RX reflected signals delay TX, does it also represent the harmonic signals of RX at the opposide of DC on the left side of 4b figure ?

3.  In conventional real baseband mixer, the IF=RF-LO and IF(image)=RF+LO, assume the IF(image) has been filtered out, so it should only have IF=RF-LO signal appear on the IF spectrum and one side of DC.

     I am confused why there are 2 IF signals on the spectrum which is located at DC left and right side as Figure 4c ? 

4. Similar question as above for figure 6, if there is a LO signal or harmonic of LO at DC left side as figure 6 left side, why it's no signal showed on the left side of figure 6c after mixed with quadrature mixer ?

Basically, i am confused why same signals (either LO or RX) are reflected on DC left and right side.

Pls. kimdly explain more detail, thanks.

  • Hello Vincent,
    Please find my reply below:

    >>1. SPYY007 Figure 4a shows the TX ramping frequency, why there are 2 frequency ramping direction ? Or it means there is a LO(TX) harmonic >>also reflected at the opposide of DC ?
    In the real only down conversion (which is what is commonly used as of today) you will always have the same signal in real band and image band. In the real only baseband you will have F1-F2 and F2-F1 because cos(-x) = cos(x). So you cannot really separate them out, both will exist.

    >>2. SPYY007 Figure 4b shows the RX reflected signals delay TX, does it also represent the harmonic signals of RX at the opposide of DC on the left >>side of 4b figure ?
    The Figure 4b the spectrum at the RX. The multiple arrows indicate multiple objects that might be present in the scene showing up as FFT peaks. Again all of them will show up in real and image band.

    >>3. In conventional real baseband mixer, the IF=RF-LO and IF(image)=RF+LO, assume the IF(image) has been filtered out, so it should only >>have IF=RF-LO signal appear on the IF spectrum and one side of DC.
    >> I am confused why there are 2 IF signals on the spectrum which is located at DC left and right side as Figure 4c ?
    I think my point 1 will help explain this as well. A complex baseband help remove this.

    >>4. Similar question as above for figure 6, if there is a LO signal or harmonic of LO at DC left side as figure 6 left side, why it's no signal >>showed on the left side of figure 6c after mixed with quadrature mixer ?
    I quadrature mixer has both cos and sin mixers and hence the image band gets rejected.

    Regards,
    Vivek
  • Hi Vivek,
    Thanks for reply, here are the following questions,
    1. I understand the spectrum for complex 1x ADC output is 0~X (X is the sampling rate), and spectrum for
    complex 2x ADC output is -X/2~+X/2 which is processed in DFE, however the spectrum of IF output for both
    complex 1x and 2x should be the same because the quadrature mixer and image band subtracted for both
    complex 1x and complex 2x, then send both I/Q IF spectrum to ADC. Am I understanding correct ? I am
    confused from below information.

    e2e.ti.com/.../719503
    Complex 2x mode, both Imaginary and Real IF spectrum is filtered and sent to ADC
    Complex 1x mode, Only Real IF Spectrum is filtered and sent to ADC

    2. The complex 2x can see both in band and image band, and image band can be used to monitor the
    interference. i don't understand why the interference still can be monitored in image band ? Will the
    interference not come from LO or RX and also cannot be subtracted by quadrature mixer ?

    3. In TI application doc. Digital Baseband Architecture In AWR1xxx Automotive Radar Devices.pdf
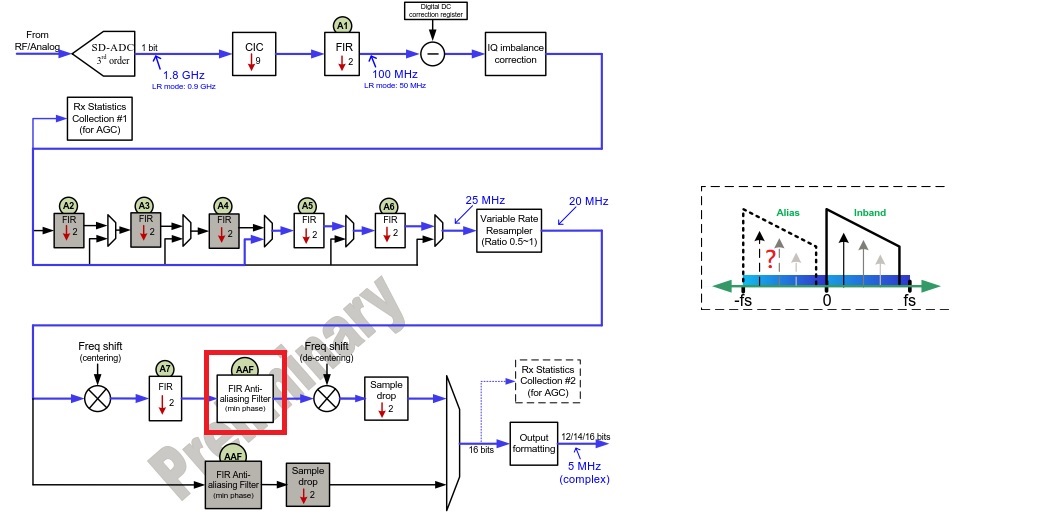
    About the left side of figure 5, I don't understand why it has alias signal at image band for complex 1x mode
    at DFE output ?

    Sorry for long questions, pls. kindly provide explanation.
  • Hello Vincent,
    Please find my reply below:

    >>1. I understand the spectrum for complex 1x ADC output is 0~X (X is the sampling rate), and spectrum for
    >>complex 2x ADC output is -X/2~+X/2 which is processed in DFE, however the spectrum of IF output for both
    >>complex 1x and 2x should be the same because the quadrature mixer and image band subtracted for both
    >>complex 1x and complex 2x, then send both I/Q IF spectrum to ADC. Am I understanding correct ? I am
    >>confused from below information.

    Both Complex 2x and 1x have a over all observation spectrum width of X. In case of complex 1X this spread between 0 to X and in case of complex 2X its -X/2 to +X/2. Internal digital design allows for getting the different bands in the two configurations.

    >> 2. The complex 2x can see both in band and image band, and image band can be used to monitor the
    >>interference. i don't understand why the interference still can be monitored in image band ? Will the
    >>interference not come from LO or RX and also cannot be subtracted by quadrature mixer ?

    The following thread will help you understand better how the interference could be seen in the image band: e2e.ti.com/.../2596992 detection#2596992

    >>3. In TI application doc. Digital Baseband Architecture In AWR1xxx Automotive Radar Devices.pdf
    >>About the left side of figure 5, I don't understand why it has alias signal at image band for complex 1x mode
    >>at DFE output ?
    In complex 1X mode the observation window is 0 to X (X is sampling rate). The 0 to -X window will have the aliased signals.

    Regards,
    Vivek
  • Hi Vivek,

    Thanks for reply,

    1. Based on 3rd questions above, the DFE will perform anti-alias filtering and also the sampling rate is > IF BW, i don't understand why it still has aliased signals on image band or why the amplitude of alias signal is same as desired signal according to below picture for complex 1x ? If there is aliased signals, does it mean the anti-alias filter has no function ? i am looking the section 3.1.2 and 3.2.1 of Digital Baseband Architecture In AWR1xxx Automotive Radar Devices.pdf.


    2. The N-point FFT size is required for complex 1x, what is the FFT size for complex 2x with complex input sample ? Is it 2N point because the 2fb.max ? Does "negative frequency components" equal to "interference" of image band after 2N-point FFT ? 

    thanks.

  • Hi Vivek

    In case you cannot see the screen shot, i attach the file for you reference.

    thanks.

  • Hello Vincent,
    That plot is before the anti aliasing filter. Finally what you get is only the 0 - Fs band data.

    Regards,
    Vivek
  • Thank you, Vivek.