This thread has been locked.

If you have a related question, please click the "Ask a related question" button in the top right corner. The newly created question will be automatically linked to this question.

AWR1642: Runtime error & execution terminated after some time

Part Number: AWR1642

Hi Experts, 

I am running the object detection demo from the industrial toolbox with some configurations tweaked.

I am inserting a plain C function with some lines of code.

The configurations are: 

-------------------------------------------------------------------------

sensorStop
flushCfg
dfeDataOutputMode 1
channelCfg 15 3 0
adcCfg 2 1
adcbufCfg -1 0 0 1 0
profileCfg 0 77 360 7 57.14 0 0 70 1 256 5209 0 0 30
chirpCfg 0 0 0 0 0 0 0 1
chirpCfg 1 1 0 0 0 0 0 2
bpmCfg -1 0 0 1
frameCfg 0 1 16 0 1000 1 0
lowPower 0 1
guiMonitor -1 1 1 1 0 0 1
cfarCfg -1 0 2 8 4 4 0 5120
cfarCfg -1 1 0 8 4 4 0 5120
peakGrouping -1 1 0 0 1 224
multiObjBeamForming -1 1 0.5
calibDcRangeSig -1 0 -5 8 256
extendedMaxVelocity -1 0
clutterRemoval -1 0
compRangeBiasAndRxChanPhase 0.0 1 0 1 0 1 0 1 0 1 0 1 0 1 0 1 0
measureRangeBiasAndRxChanPhase 0 1.5 0.2
nearFieldCfg -1 0 0 0
CQRxSatMonitor 0 3 4 127 0
CQSigImgMonitor 0 63 8
analogMonitor 1 1
lvdsStreamCfg -1 0 0 0
sensorStart

----------------------------------------------------------------------------

While executing the demo, after processing of some frames,  I get the following error:


In My_func: START
In My_func: END

In My_func: START
In My_func: END

In My_func: START
In My_func: END

In My_func: START
In My_func: END

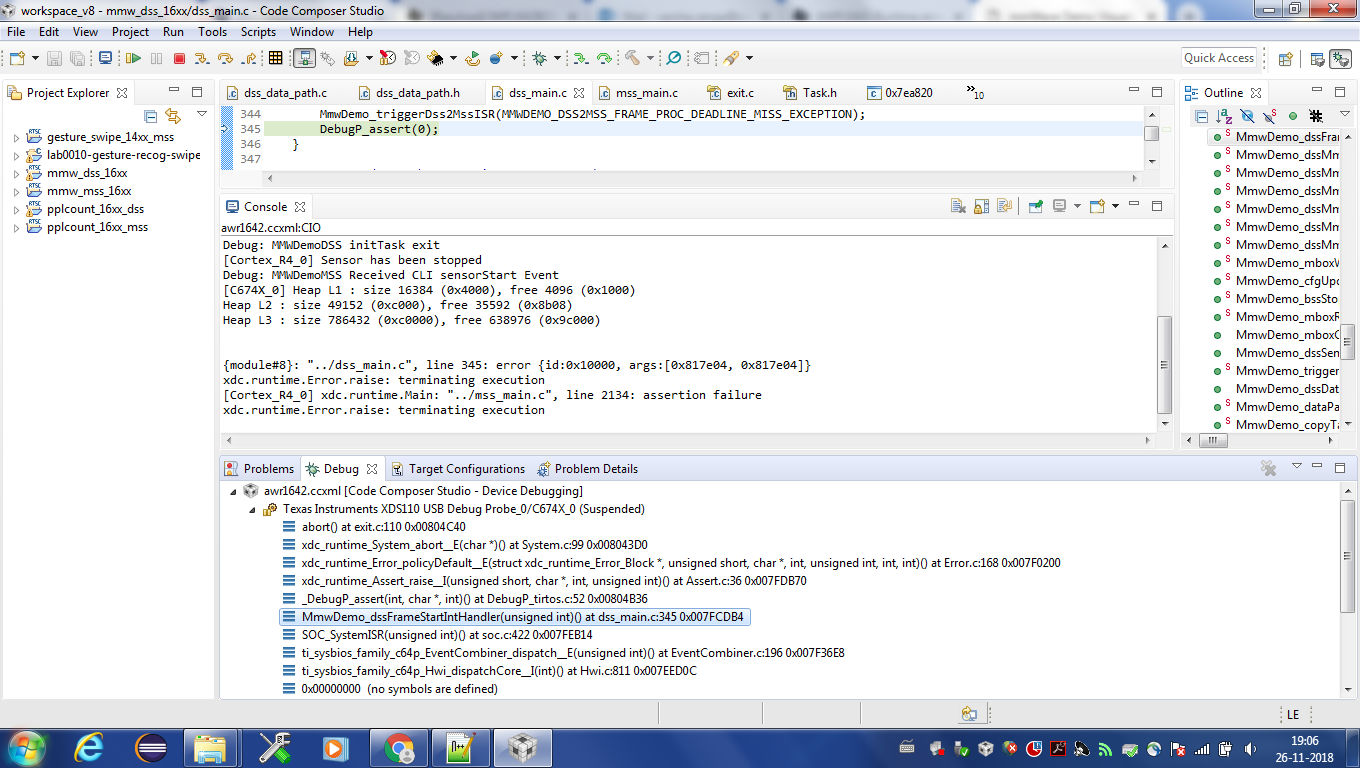
{module#8}: "../dss_main.c", line 345: error {id:0x10000, args:[0x8182a4, 0x8182a4]}
xdc.runtime.Error.raise: terminating execution
[Cortex_R4_0] xdc.runtime.Main: "../mss_main.c", line 2134: assertion failure
xdc.runtime.Error.raise: terminating execution

Can I know what is causing the error? Why is it crashing after some time? Memory related issue?

Regards,

 Varsha

  • Hi Varsha,
    If added new code eats up some time and blocks DSS there then while doing the FFT for chirp/frame it may hit the assert in the chirp/frame-intHandler function where it check if last chirp/frame processing is done are not.
    So, please calculate new code time consumption.

    Regards,
    Jitendra
  • Hi Jitendra, 

    Yes, as you said it hits the assert in the frame int handler & fails there. The code I have added is a plain function with no long processing, it just adds the 2 numbers & prints it.  I have used the _itoll(TSCH, TSCL); to calculate the cycles of the function. 

    Following is the screenshot which shows my error: 


    Can you please help me with this.

    Regards,

    Varsha

  • Don't add any system_printf (to CCS console), even though there is much code to execcute but printf to console function causes much more delay to execution flow. As for this print CCS intermettently halt the core and reads the value (if any) for printf, which effectively cause the delay and core will hit the assert.
    So, avoid adding any system_printf fuction when FFT processing is ongoing.


    Regards,
    Jitendra
  • Hi Jitendra,

    Thank you for your response. Yes, I will avoid using prints to the console.


    Regards,
    Varsha
  • Hi Jitendra, 

    Could you please let us know the method to check a particular value as we cannot print it on the console ? 

    Your response will be appreciated. 

    Thanks in advance. 

    Regards,

    Varsha

  • You can use DSS/MSS UART-print to output the variables to the PC serial terminal.
    If you want to use DSS UART, it comes on DevPack FTDI COM port (3rd USB COM port) and MSS has two UART which you use.
    You can get code reference from UART driver test application (packages\ti\drivers\uart\test\xwr16xx) to add DSS UART into your application.

    And if you need to just measure the execution time by any function then better to add those timestamp value in some global variables and after few frame run halt the core and extract the value (or array of values) from CCS. Note- in this case DSS may go into fault when you halt and run it again, so you need to provide much time to get all the expected timestamp values updated for your measurements.

    Regards,
    Jitendra
  • Hi Jitendra, 

    Thank you for the quick response. I will look into it & get back to you. From surfing through the forum , I came across things like DebugP_log1 and Log_print1. Can I use them to get the stuff on the console? Will these cause the issues like that of delay ....? 

    Regards,

    Varsha

  • Hi Varsha,
    On top of last suggestion, I would request you to go over mmWave SDK User guide (section -6) where it has miscellaneous information about CCS Debugging of real-time application. There it explains how to enable DebugP logs.

    Regards,
    Jitendra
  • Hi Jitendra,

    I am able to enable DebugP logs. I have put the number of entries to 100(As per document this was causing memory issues,so I have reduced it). But the issue is I can see the values in ROV, but when I refresh it more than once, I get following errors in CCS Console:

    [Cortex_R4_0] **********************************************
    Debug: Launching the Millimeter Wave Demo
    **********************************************
    Debug: MMWDemoMSS Launched the Initialization Task
    Debug: MMWDemoMSS mmWave Control Initialization was successful
    [C674X_0] Debug: MMWDemoDSS mmWave Control Initialization succeeded
    [Cortex_R4_0] Debug: CLI is operational
    [C674X_0] Debug: MMWDemoDSS Data Path init succeeded
    Debug: MMWDemoDSS initTask exit
    [Cortex_R4_0] Sensor has been stopped
    Debug: MMWDemoMSS Received CLI sensorStart Event
    [C674X_0] Heap L1 : size 16384 (0x4000), free 4096 (0x1000)
    Heap L2 : size 49152 (0xc000), free 35368 (0x8a28)
    Heap L3 : size 786432 (0xc0000), free 499712 (0x7a000)
    A0=0x0 A1=0xffffff6f
    A2=0x78 A3=0x49
    A4=0xffffff96 A5=0x27
    A6=0x5a82799a A7=0x5a82799a
    A8=0xffffff3e A9=0x7fffffff
    A10=0x2 A11=0xf00220
    A12=0xf002a0 A13=0x0
    A14=0x809b60 A15=0xf00200
    A16=0x5a82799a A17=0xa57d8666
    A18=0xffffff62 A19=0xfffffc28
    A20=0xffffff56 A21=0x74
    A22=0xffffff9b A23=0x83
    A24=0xffffff32 A25=0x1b0
    A26=0xffffffdc A27=0x74
    A28=0x13a A29=0x0
    A30=0x6 A31=0x0
    B0=0x0 B1=0xfffffddb
    B2=0xffffffc1 B3=0x2
    B4=0x0 B5=0x0
    B6=0xffffffde B7=0xfffffbf5
    B8=0x0 B9=0xf00218
    B10=0xfffffffe B11=0xfffffe40
    B12=0x30 B13=0x6
    B14=0x81ff88 B15=0x8183b0
    B16=0x94 B17=0x5c
    B18=0xffffffd3 B19=0xd1
    B20=0x1b4 B21=0xf00298
    B22=0x0 B23=0x7fffffff
    B24=0x46 B25=0x172
    B26=0xffffffe5 B27=0xfffffff0
    B28=0x0 B29=0x209
    B30=0x1b B31=0x47
    NTSR=0x1420d
    ITSR=0x20d
    IRP=0xe01ee0
    SSR=0x0
    AMR=0x0
    RILC=0x4
    ILC=0x1
    Exception at 0xe001f8
    EFR=0x2 NRP=0xe001f8
    Internal exception: IERR=0x180
    Loop buffer exception
    Missed stall exception
    {module#26}: line 256: error {id:0xb0000, args:[0xe001f8, 0x8183b0]}
    xdc.runtime.Error.raise: terminating execution
    [Cortex_R4_0] xdc.runtime.Main: "../mss_main.c", line 2109: assertion failure
    xdc.runtime.Error.raise: terminating execution

    Same is the case when I enable "Repeat Refresh". I want to check the constantly changing variables.

    Can You help me with this?

    Regards,

    Varsha

  • Are you using the real-time mode in CCS (there are real-time icons at the top)? Please see the notes in the section Jitendra mentioned in the UG with respect to a care-about when looking real-time on the DSP (if you don't follow that, there will be the kind of crash that you see). If you are using classic ROV, it will only work in non real-time i.e you have to stop the code to see it. If you use new ROV, you can see logs in real-time.