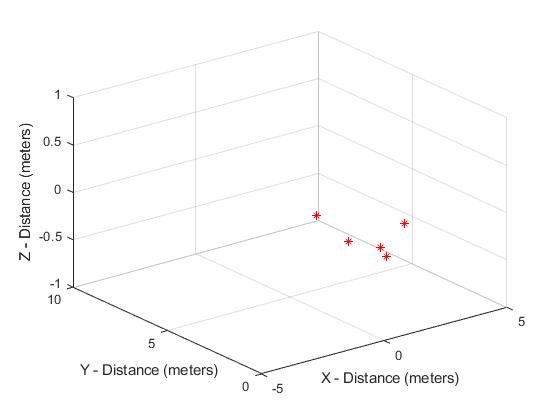
I ran the IWR6843 board using mmwave demo visualizer and recorded the UART data in the .dat file. Now I have written a MATLAB code to read the .dat file and store all the relevant information (x,y,z,doppler) and Range/Noise profiles in MATLAB variables. Range/Noise profiles look good but somehow the x,y, and z values are not the same that I see in the demo visualzier 3D scatter plot. There is something wrong in getting the floating point values.
This is a simple MATLAB code I am using to read the detected points:
%% LIST OF DETECTED OBJECTS
% doppler velocity, and x,y, and z locations of detected objects.
if outputpkt(counter).tlv(tlvcounter).tlv_type == 1
outputpkt(counter).tlv(tlvcounter).tlv_length = fread(fin,1,'uint32');
outputpkt(counter).tlv(tlvcounter).tlv_payload = struct;
nbytes = nbytes + 4;
if outputpkt(counter).numDetectedObj ~= 0
for detectedObjcounter = 1:outputpkt(counter).numDetectedObj
outputpkt(counter).tlv(tlvcounter).tlv_payload(detectedObjcounter).x = fread(fin,1,'float');
outputpkt(counter).tlv(tlvcounter).tlv_payload(detectedObjcounter).y = fread(fin,1,'float');
outputpkt(counter).tlv(tlvcounter).tlv_payload(detectedObjcounter).z = fread(fin,1,'float');
outputpkt(counter).tlv(tlvcounter).tlv_payload(detectedObjcounter).dopplerVel =fread(fin,1,'float');
nbytes = nbytes + 16;
end
end
I see the detected points are different on the 3D scatter plot.
Regards,
Attiya


