


Hi,
So I'm trying to develop a new application for IWR devices, and I've so far been testing out the demo program and some of the Industrial Toolbox labs. The device I have is the IWR1443BOOST ES2.0
I'm trying to write a program which reads information from the EVM and automatically processes it further on the computer into a format I can use for other elements of a process. I was wondering if there's any source available for the Demo Visualiser so that I can see how it captures the UART data and transforms it?
The application is in surface mapping, but the out of the box demo documentation seems to show that the identification of objects in the CFAR algorithms relies on Range/Velocity and doesn't distinguish objects sharing these at different azimuth positions? Is this correct? Or is there a way to alter the demo to consider range and azimuth as the parameters to distinguish objects, so that I may detect 'objects' as points along a surface. Alternatively if this is not possible, is it correct that the radarcube information can in the (range, azimuth, elevation) data be analagous to a 3D heatmap? This is the impression given to me by the responses here.  . If so, is it possible to extract this information directly from the IWR1443BOOST (with or without extra equipment) to process the 3D cube in my own external program?
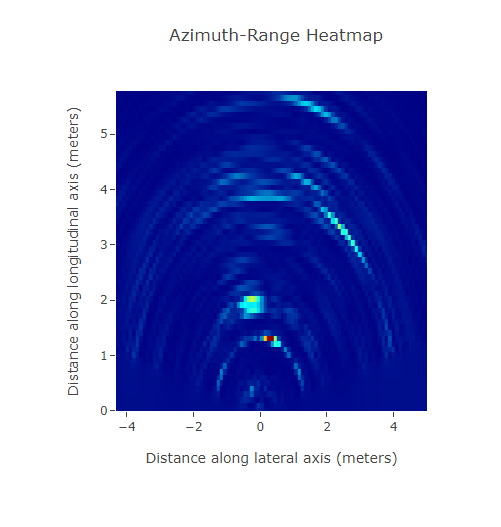
Additionally I noted this haloing effect when viewing a heatmap, and wondered if this is caused by a lack of angular resolution in the chip we have? (there is some rusting)
Many Thanks,
Lachlan
