This thread has been locked.

If you have a related question, please click the "Ask a related question" button in the top right corner. The newly created question will be automatically linked to this question.

IWR1443: Velocity uncertainty

Part Number: IWR1443

Hi,

I was examining the detected object and range data for a moving dihedral reflector (single point scatterer).  Attached is a range image for one frame.  It shows an isolated scatterer with the peak value and range information from the detected object listing plotted with red x's. This appears to be okay.  My dilemma is that the velocity reported for each detected object is not consistent (in this case the object is moving away). Shown below is the object data listing for the give frame.   I would have expected the same index for each object.  I have included the configuration file too.  Can you please provide me with advice on how I should configure the sensor so I can obtain more reasonable velocity data, i.e., the same velocity index value?

Thank you.

Al

       Frame  Range  Velocity   Peak
                      Index     Index     Value
          22         153      0       11712
          22         155      3       11712
          22         153      5       10816
          22         152      6       11456
          22         154      6       10944
          22         154      7       10944
          22         152     -6       11008
          22         154     -6       11264
          22         153     -4       10624

sensorStop
flushCfg
dfeDataOutputMode 1
channelCfg 2 1 0
adcCfg 2 1
adcbufCfg 0 1 0 1
profileCfg 0 77 7 5.6 164.84 0 0 18.97 1 556 3514 0 0 30
chirpCfg 0 0 0 0 0 0 0 1
frameCfg 0 0 16 0 75 1 0
lowPower 0 0
guiMonitor 1 1 0 0 0 0
cfarCfg 0 2 8 4 3 0 4000
peakGrouping 1 1 1 1 1023
multiObjBeamForming 1 0.5
clutterRemoval 1
calibDcRangeSig 0 -5 8 256
compRangeBiasAndRxChanPhase 0.0 1 0 1 0 1 0 1 0 1 0 1 0 1 0 1 0 1 0 1 0 1 0 1 0
measureRangeBiasAndRxChanPhase 0 1.5 0.2
CQRxSatMonitor 0 3 5 123 0
CQSigImgMonitor 0 119 4
analogMonitor 1 1
sensorStart

  • Former Member
    0 Former Member
    Hello Allen,

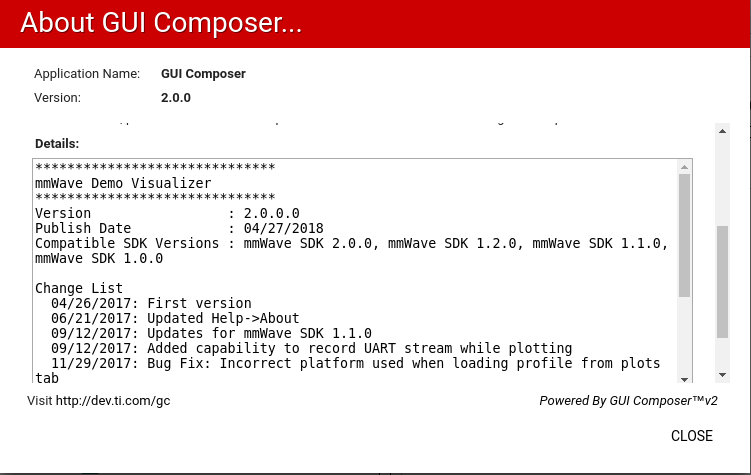
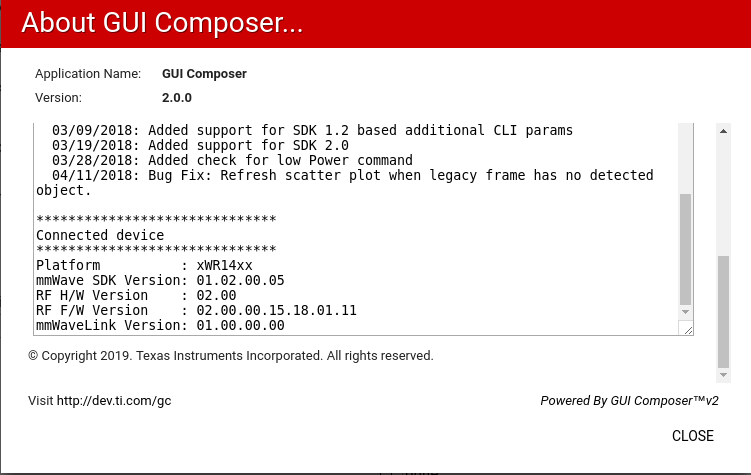
    Can you provide which software & version you are using for: a) the mmWave device b) data visualizer/logger?

    Thanks,
    Amanda
  • Hi Amanda,

    Thanks for the quick response.

    I will not be able to provide the exact details until Friday morning.  I am using a D3 Engineering Sensor Starter Kit with a IWR1443 chip.  The gui is the mmWave Demo Visualizer Ver 2.0.0, SDK Ver 1.2.0.5 (from memory).  I can provide the exact information from the About tab tomorrow.  I should have the default xwr14xx_mmw_demo_mss.bin load.  Is there a way to query the part to verify the load?

    The data was written to a file and plotted.

    Al

  • Former Member
    0 Former Member in reply to allen dominek
    Allen,

    Can you use this mmWave Demo Visualizer that records the detected object data directly to a CSV file to verify that it isnt an issue in parsing the written data?

    dev.ti.com/.../

    To check the version you can open a Tera Term for the (user/uart port not the data port. Make sure baud rate is 115200). Hit the return key. Then you should see the prompt "mmwDemo:/>" appear. Then type version and you can see the information similar to below.


    ******************************************
    xWR14xx MMW Demo 02.01.00.00
    ******************************************
    mmwDemo:/>
    mmwDemo:/>version
    Platform : xWR14xx
    mmWave SDK Version: 02.01.00.00
    RF H/W Version : 02.00
    RF F/W Version : 02.00.00.15.18.01.11
    RF F/W Patch : 00.00.00.00.00.00.00
    mmWaveLink Version: 01.01.00.05
    Done
    mmwDemo:/>

    Amanda
  • Amanda,

    Attached are some screen shots (four) for the About information which should document the configuration I have.  The bin files used are

    bytes

    196692 xwr12xx_xwr14xx_radarss.bin
    117580 xwr14xx_mmw_demo_mss.bin

    Al

  • Amanda,

    I will try an generate a cvs file.  I did think about if I had improperly converted the data format but

    1. Considering that I did not error on all the other data components, it most likely did the signed data correctly.

    2. I have another demo version that I have altered for a specially application where I can print out the velocity values to the console.  This is what made me go back to the stock demo version and examine that data.  Both versions appear to be in error.

    I have sent you the About information in previous posting.  This should address the second request.

    Al

  • Amanda,

    I do not have an internet connection for me to run this visualizer version for were the hardware is. Can you please provide a link for a linux standalone version?

    Al
  • Amanda,

    I examined the binary file with a hex editor the visualizer created for the data I showed you in my first post. I have to say that I extracted the data properly.

    Al
  • Amanda,

    What do  you suggest that that I do to debug this issue?

    Al

  • Hi Amanda,

    I acquired the latest version of the visualizer (3.1).  I saw no means to create a cvs file.  The data output is still binary.  The user manual does not indicate a cvs capability either.  Can you please provide me with more guidance?

    I reloaded the stock 1.2 binary and set the cfar threshold to a value of 4000 to minimize erroneous output of data.  Some frames have realistic data but others have a spread of velocities.

    Thanks.

    Al

  • Former Member
    0 Former Member in reply to allen dominek
    Allen,

    The CSV capability is in a different version of the visualizer. I had linked to it in my previous post: dev.ti.com/.../

    Amanda
  • Hi Amanda,

    I did use your link to acquire the version of the visualizer that  "should" have the cvs capability.  I down loaded is since my environment does not have internet access.  I was given three options.  Two were obsolete so I the the current version of 3.1.

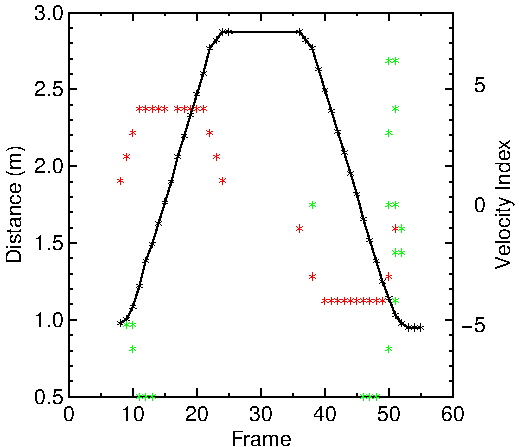
    Anyway I plotted some data for  you.  This should demonstrate that I am recovering the velocity data correctly.  The attached graph shows the distance of a dihedral reflector moving along a track at ~2 m/s.  First it moves away and then returns.  The distance is shown in black with asterisks indicating the actual values.  These were obtain from that range data. Plotted in color are the velocity values obtained from the detected object data. The red asterisks are the realistic values showing where the dihedral is accelerating and de-accelerating to the terminal velocity of 2 m/s.  An indice of +/- 4 corresponds to a velocity of 2 m/s for the configuration values.  The green asterisks are the erroneous values.  All velocity values had large peak values associated with them in the detected objects array.

    If I were recovering the data improperly, I doubt I would have been able to have values that would be consistent with the motion of the dihedral.

    Please advise.

    Al

             Frame       Range  Velocity  Peak
         Number       Idx     Idx     Value
               8          35      1       11520
               9          35      2       11200
               9          38      2       11328
               9          37     -5       11328
              10          38      3       11328
              10          41      3       11392
              10          39     -6       11008
              10          39     -5       11008
              11          39      4       10048
              11          44      4       11328
              11          86     -8       10304
              12          44      4        9472
              12          49      4       11456
              12          96     -8        9792
              13          54      4       11456
              13         107     -8        9984
              14          59      4       11520
              15          64      4       11520
              17          75      4       11264
              18          80      4       11328
              19          85      4       11520
              20          90      4       11648
              21          95      4       11584
              22         100      3       11264
              23         103      2       11136
              24         105      1       11008
              36         105     -1       10368
              38         101      0        9728
              38         101     -3       11264
              40          91     -4       11392
              41          86     -4       11520
              42          81     -4       11456
              43          76     -4       11392
              44          71     -4       11264
              45          66     -4       11328
              46         119     -8        9856
              46          61     -4       11520
              47         109     -8        9920
              47          55     -4       11392
              48          99     -8        9856
              48          50     -4       11328
              49          40     -4        9856
              49          45     -4       11584
              50          41      0       10880
              50          41      3       10944
              50          41      6       10944
              50          41     -6       10944
              50          40     -3       11712
              51          37      0       11456
              51          38      4       11200
              51          38      6       11072
              51          37     -4       11328
              51          36     -2       11648
              51          39     -2       11072
              51          38     -1       11328
              52          68     -2       10368
              52          35     -1       11648

  • Hi Amanda,

    I had posted some material a few days ago but I guess an error occurred since I do not see it.  I did use your link you provided to

    obtain a copy with csv capability.  Since I do not have an internet connection where the hardware is, I downloaded a copy from the pull

    down tab.  It directed me to another page with three versions.  Two were obsolete so I acquired version 3.1 which I used but I saw no csv

    capability.  I see that the online version is 1.1.1. Since acquiring this version to demonstrate that I am not making an

    error in the data conversion did not work, I took two other approaches to demonstrate that I am not reading the hex file improperly.

    First I found the section of the output file in a hex editor and circled the velocity values and showed the ascii values as shown in the attached

    image.  These ascii values are the same as I reported earlier. 

    Secondly, I plotted the data in a hopefully convincing manner.  As I

    indicated, I am moving a dihedral away from me, stopping and back to me over a ~3m length.  The constant velocity is ~2 m/s.  Attached is a

    graph of the dihedral distance from the sensor plotted with a black line and with asterisks at each sample point.

    The velocity data is plotted with colored asterisks.  The red asterisks is data I can believe.  It shows the dihedral accelerating

    to its terminal velocity and then and near the end of the track, it slows down to a stop.  The process is repeated for the return trip.

    The green asterisks represents data that appears to be erroneous.  If I am not properly converting the binary data, I believe that none of

    the asterisks could be correlated to the dihedral motion.

    I have plotted other frames too.  They also show erroneous data through out the frame.

    In review, I think I have demonstrated that the original data I presented is an accurate rendition of the ouput data and I have

    plotted this data in a meaningful way for review.  Your thoughts?

    Thank you for your time.

    Al