


Hi,
I use OOB demo v2.1.
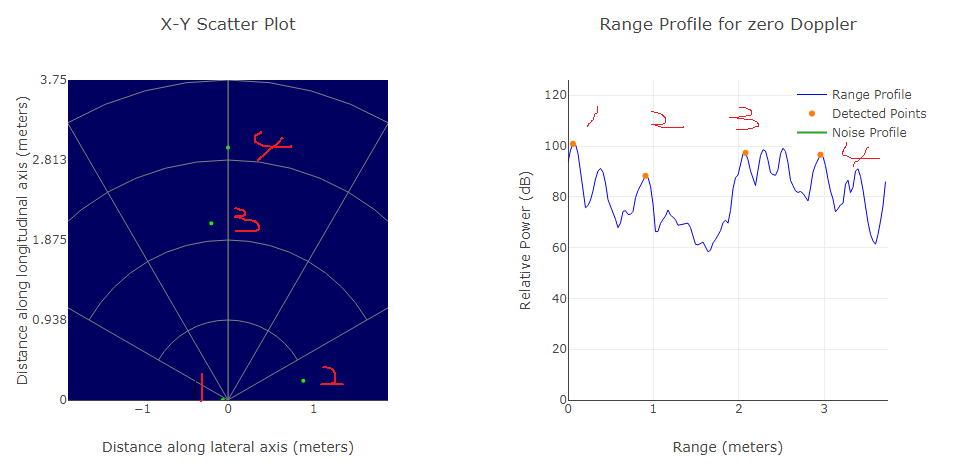
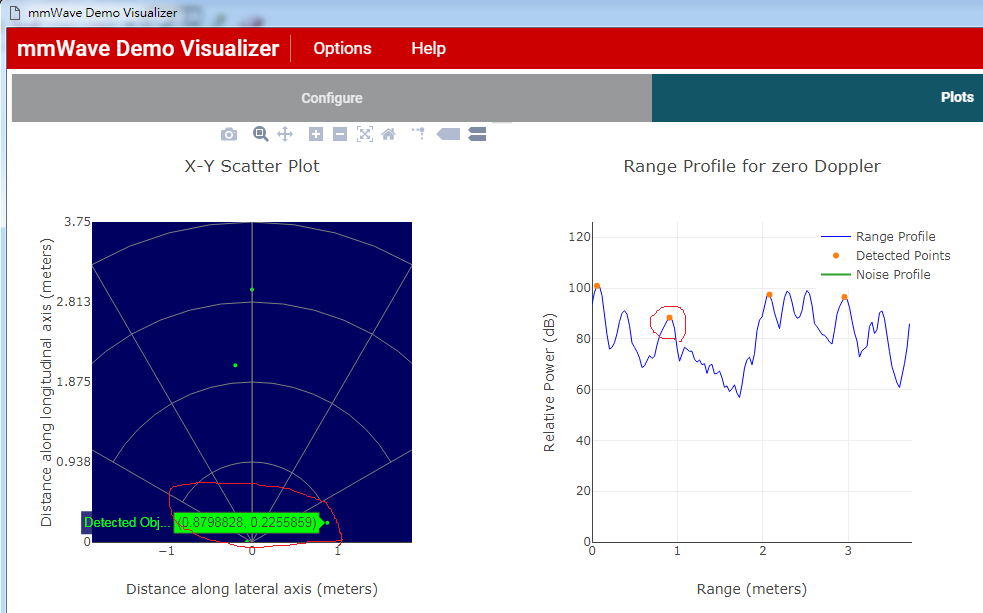
Check point-2, axis are x = 0.879, y = 0.225, form range profile plot to see, why point-2 range (meter) is 0.88 m?
e.g. point-3, axis are x = -0.20, y = 2.07, so range (meter) is close to 2.07 m
Thanks.
Hi,
I use OOB demo v2.1.
Check point-2, axis are x = 0.879, y = 0.225, form range profile plot to see, why point-2 range (meter) is 0.88 m?
e.g. point-3, axis are x = -0.20, y = 2.07, so range (meter) is close to 2.07 m
Thanks.

