This thread has been locked.

If you have a related question, please click the "Ask a related question" button in the top right corner. The newly created question will be automatically linked to this question.

WEBENCH® Tools/AWR1642BOOST: Get Data for People Detection

Part Number: AWR1642BOOST
Other Parts Discussed in Thread: AWR1642,

Tool/software: WEBENCH® Design Tools

hello,

i'm trying to get raw data from demo visualizer from button log start here :  then here the file .csv that i got :

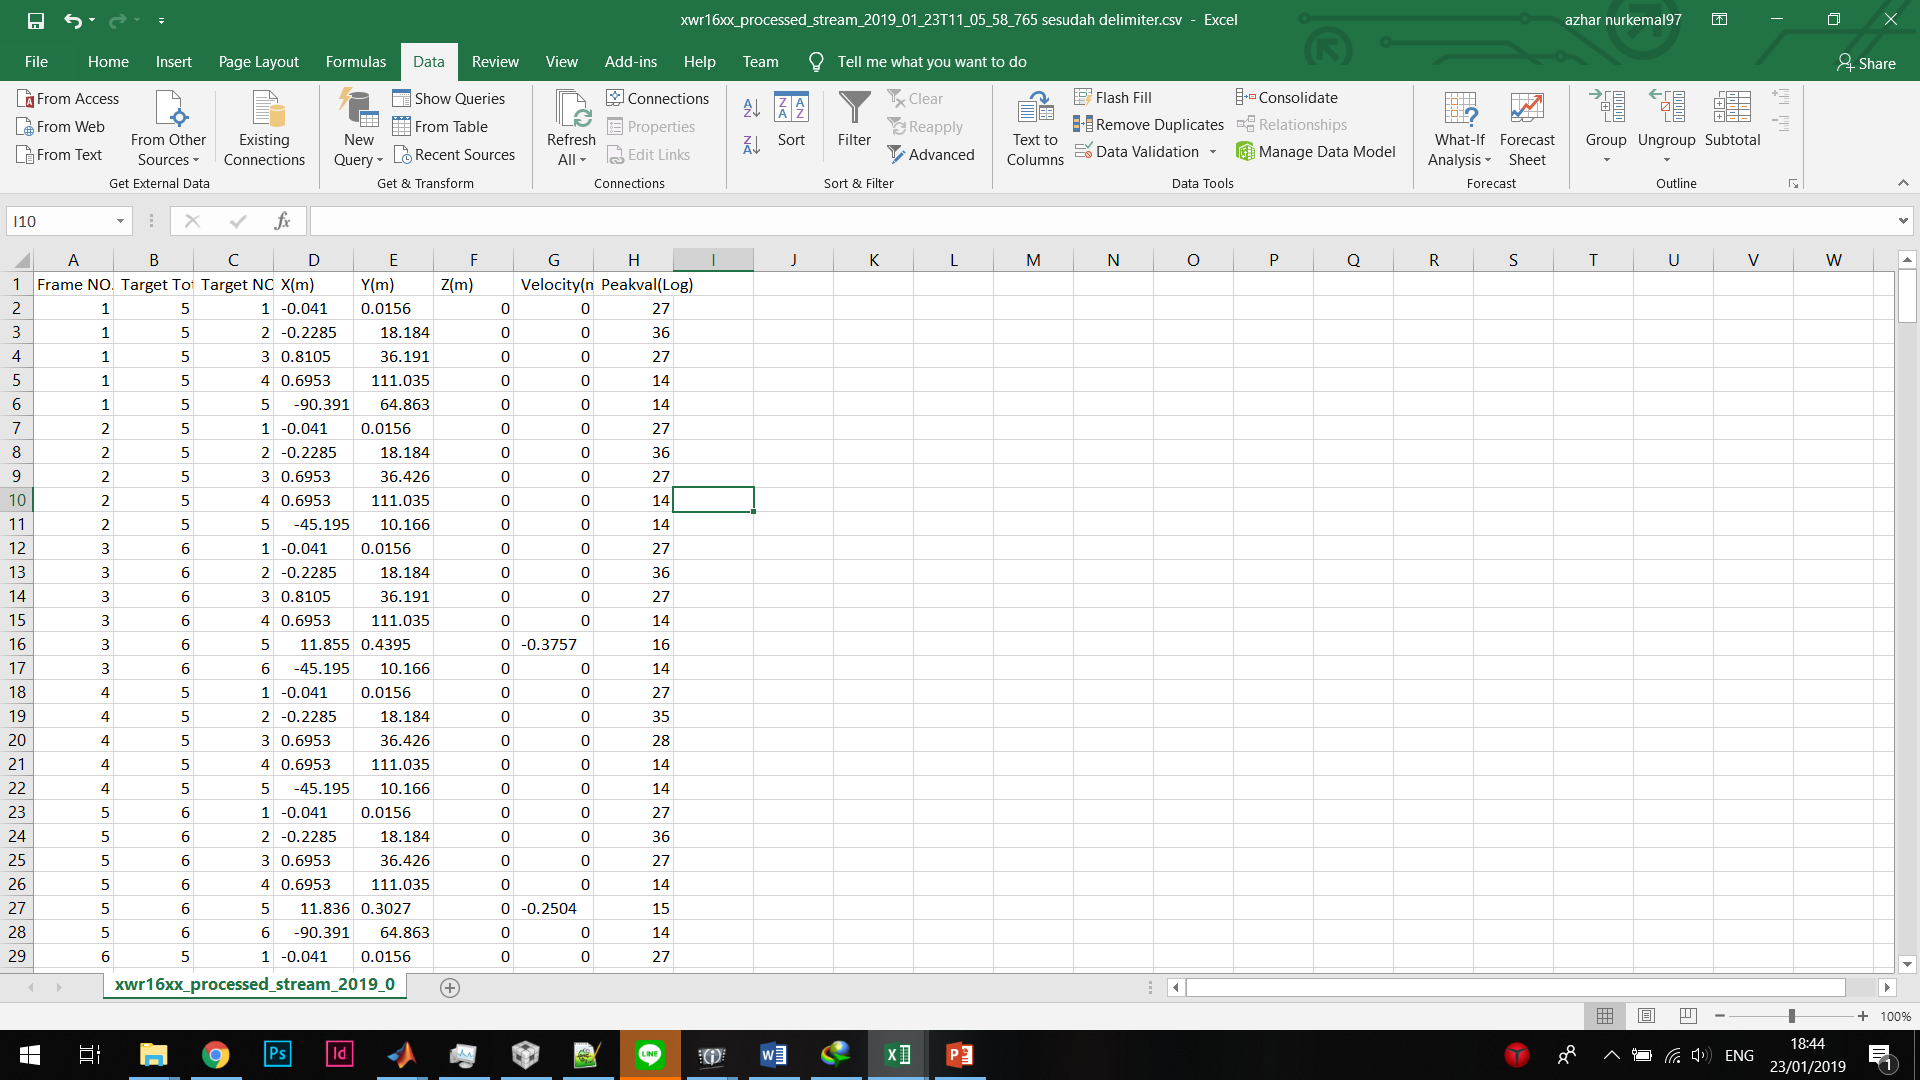
the problem is the data above is not accurate enough for tracking object. we tried using only 2 human motions but the data get target randomly, its hard to know which target number(Target NO.) for representation 2 humans.

my question :

1) how does AWR1642 algorithm recognize any object as human like demo GUI from here "C:\ti\mmwave_industrial_toolbox_3_1_0\labs\lab0011-pplcount\lab0011_pplcount_quickstart\pplcount_gui.exe"?

2) can i use that file (.csv)  or get another data from AWR1642BOOST as input for Machine learning/ Deep learning to implement that algorithm for people detection/counting ? if there is another data that i can use for human detection/counting how can i get them only using AWR1642BOOST?

  • Hi,
    Let me assign this thread to relevant expert to help you with this query.

    Regards,
    Jitendra
  • Hi Azhar,

    There is a TI Design document that goes over the function of the tracker.  This demo uses a different signal chain than that of the OOB demo, which produces a rich point cloud for human targets.

    Regardless, please use the options in the Online Visualizer to turn off the peak grouping feature.  This feature removes points from the point cloud, which hides clusters. Tracking a target with radar will require a cluster of points.

    You can also run the lab0011 People counting demo on the AWR1642 device.

    Regards,

    Justin

  • Thanks for the quick reply Jitendra and Justin,

    from the user guide in mmWave Demo Visualizer the peak grouping feature "instead of reporting a cluster of detected neighboring points, only one point, the highest one, is reported". which is different function from group tracker for the lab0011 People counting demo that i found from here _> e2e.ti.com/.../Tracking-radar-targets-with-multiple-reflection-points.pdf .

    my next question is :

    1) what exactly is the input for group tracker algorithm? if i'm not mistaken, one of the input is the notation for kalman filter operations "() – State vector of tracking object at time . Each tracking object has its own state vector, which is predicted and updated independently. For simplicity reasons we omit the tracking index. ", but how can I get that data? can I get that from fhistRT.mat in the lab0011 People counting demo?

    fhistRT.mat -> "C:\ti\mmwave_industrial_toolbox_3_1_0\labs\lab0011-pplcount\lab0011_pplcount_quickstart\fhistRT.mat"

    2) is there any description or user guide for what every header from fhistRT.mat is for?

    thanks
  • Hi Azhar,

    The tracker takes the point cloud in the format:

    1. Range
    2. Angle
    3. Velocity
    4. SNR

    The tracker also uses state information from the last frame - this is handled internally, so you do not need to provide it as input.

    In the fHist,

    • pointCloud is the radar detection points in the format described above
    • Target List has the target information - S is the state vector in this format:
      • X
      • Y
      • Velocity X
      • Velocity Y
      • Acceleration X
      • Acceleration Y
    • mIndex links pointCloud from the previous frame to tracked objects.  This is used in the GUI to color points and tracks the same color.

    The rest of the data in the fHist is mostly benchmark info.  Please read the TI Design for more.

    Regards,

    Justin