This thread has been locked.

If you have a related question, please click the "Ask a related question" button in the top right corner. The newly created question will be automatically linked to this question.

AWR1443BOOST: Rounded surface of detected points in awr1443BOOST in ROS

Part Number: AWR1443BOOST

Greetings,

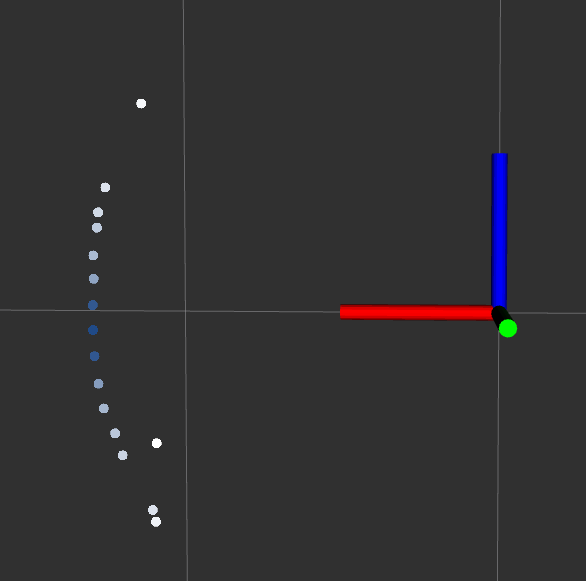
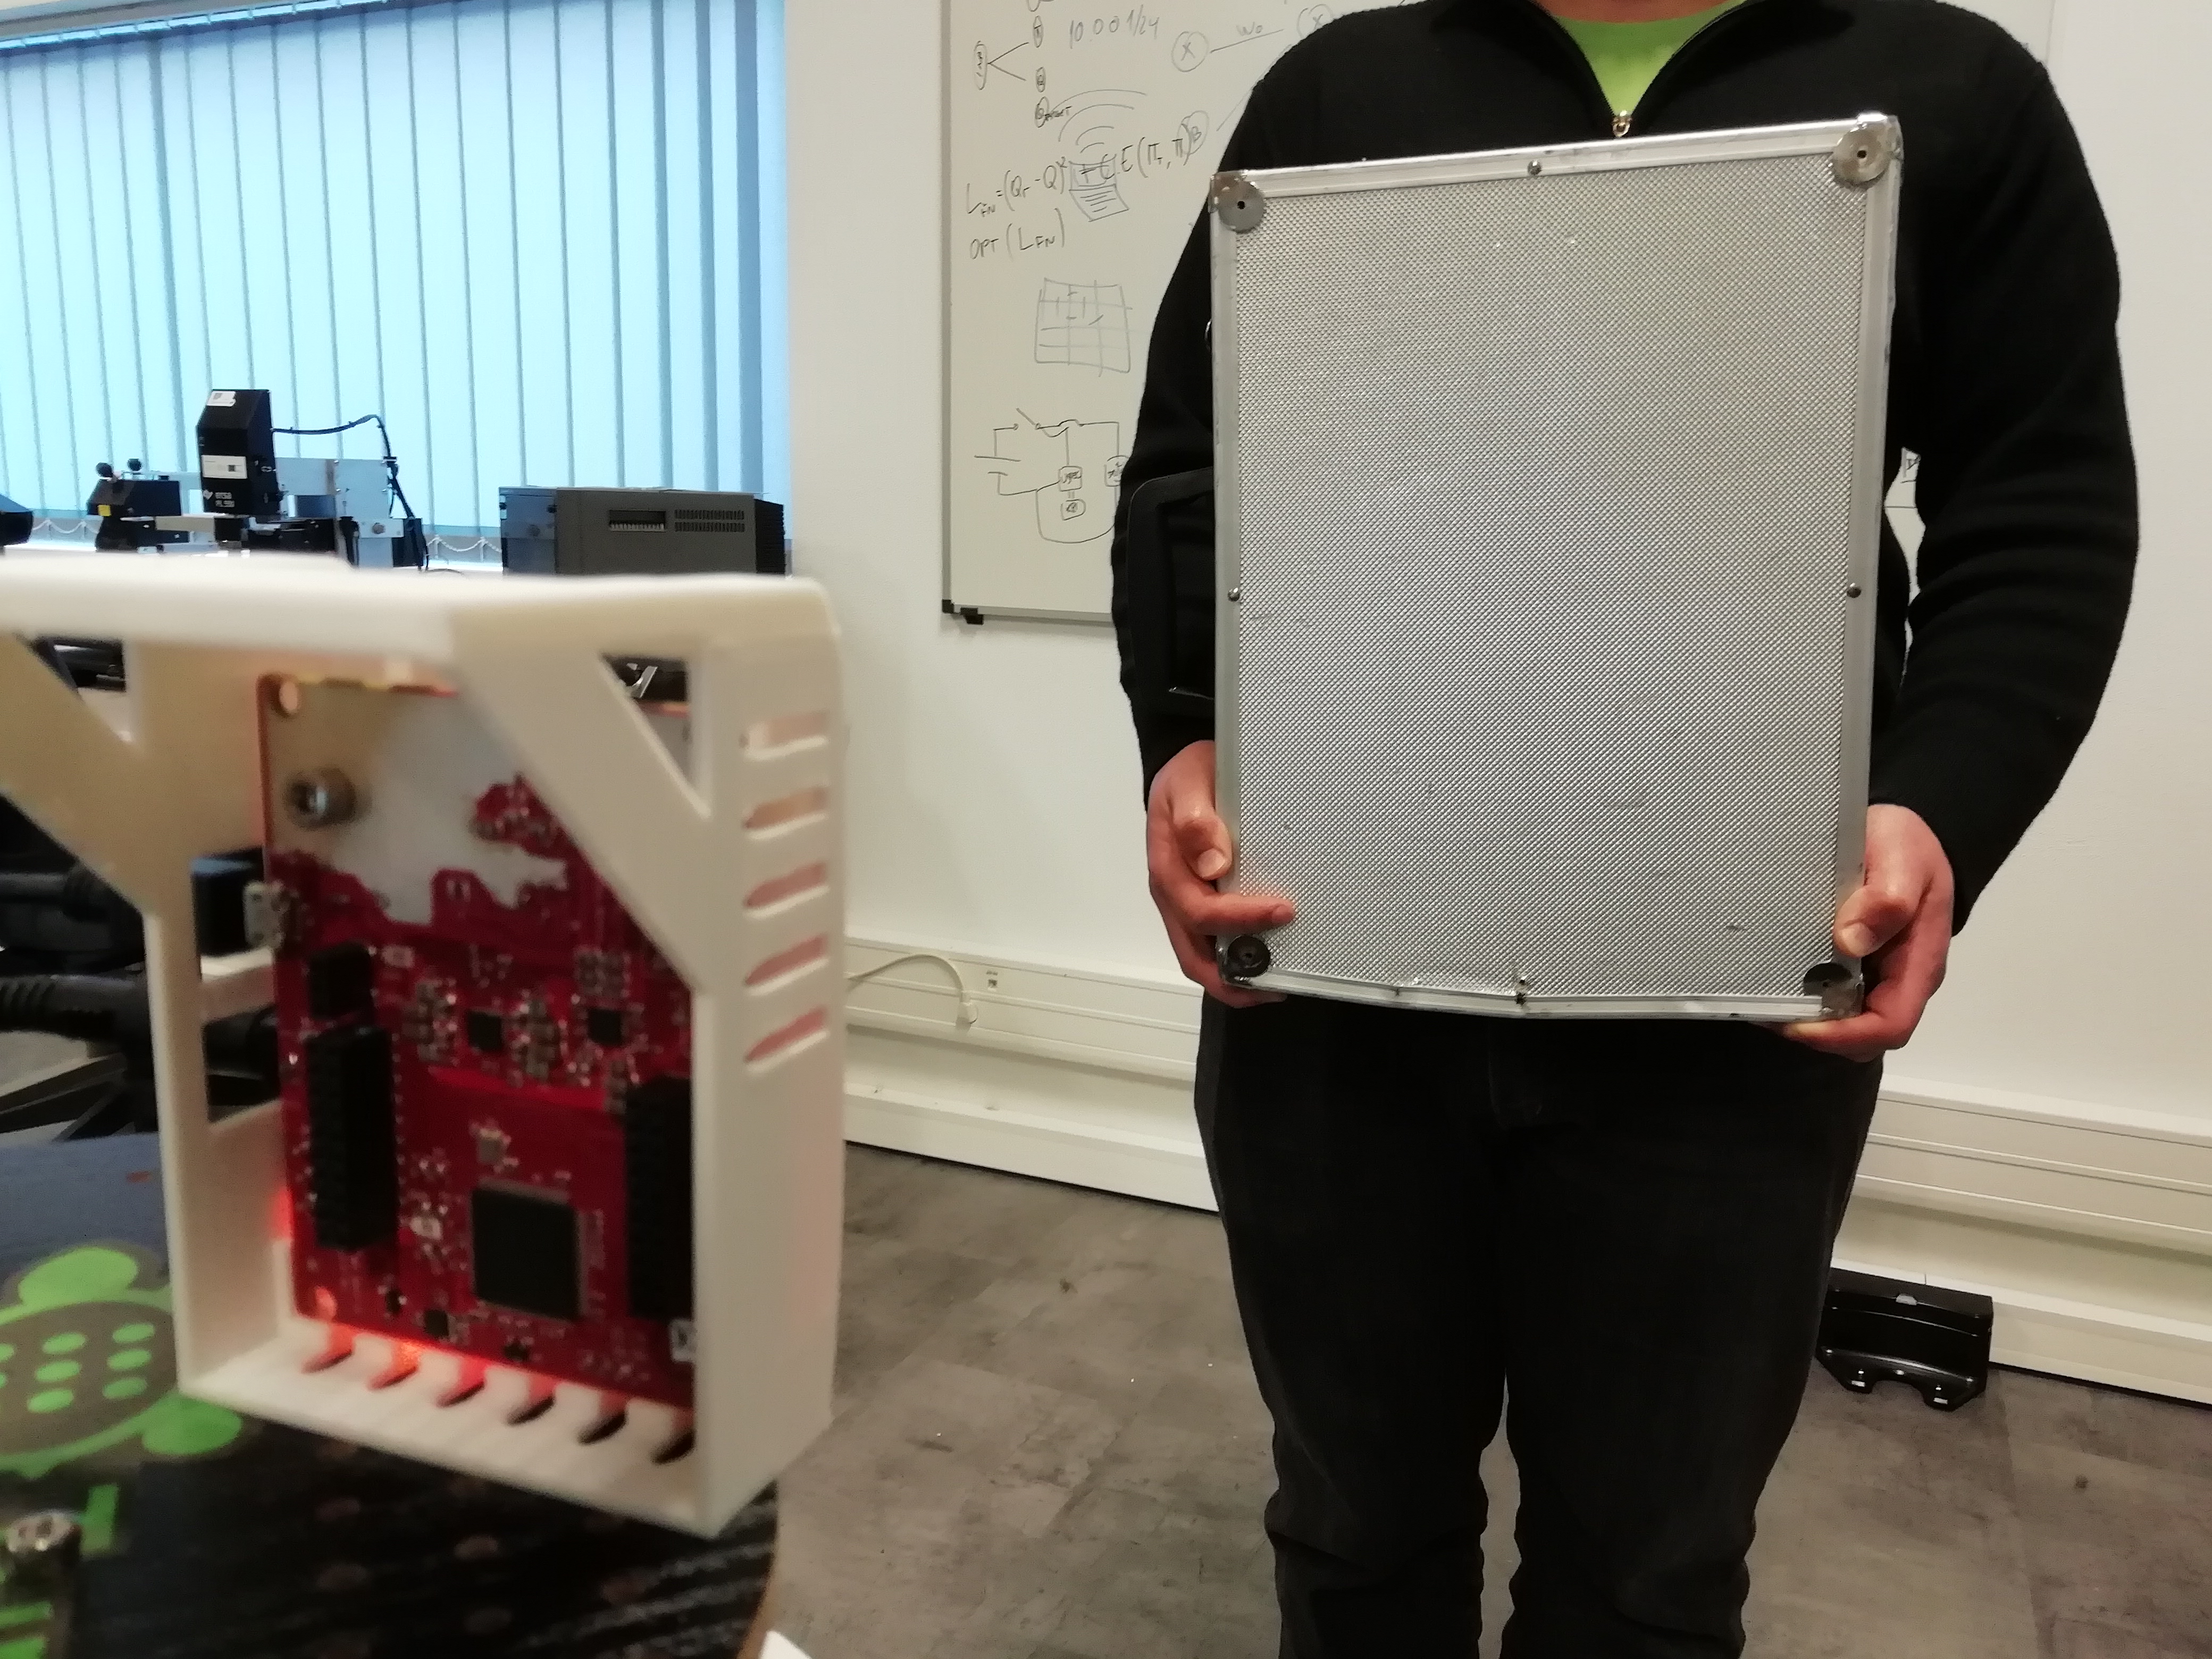
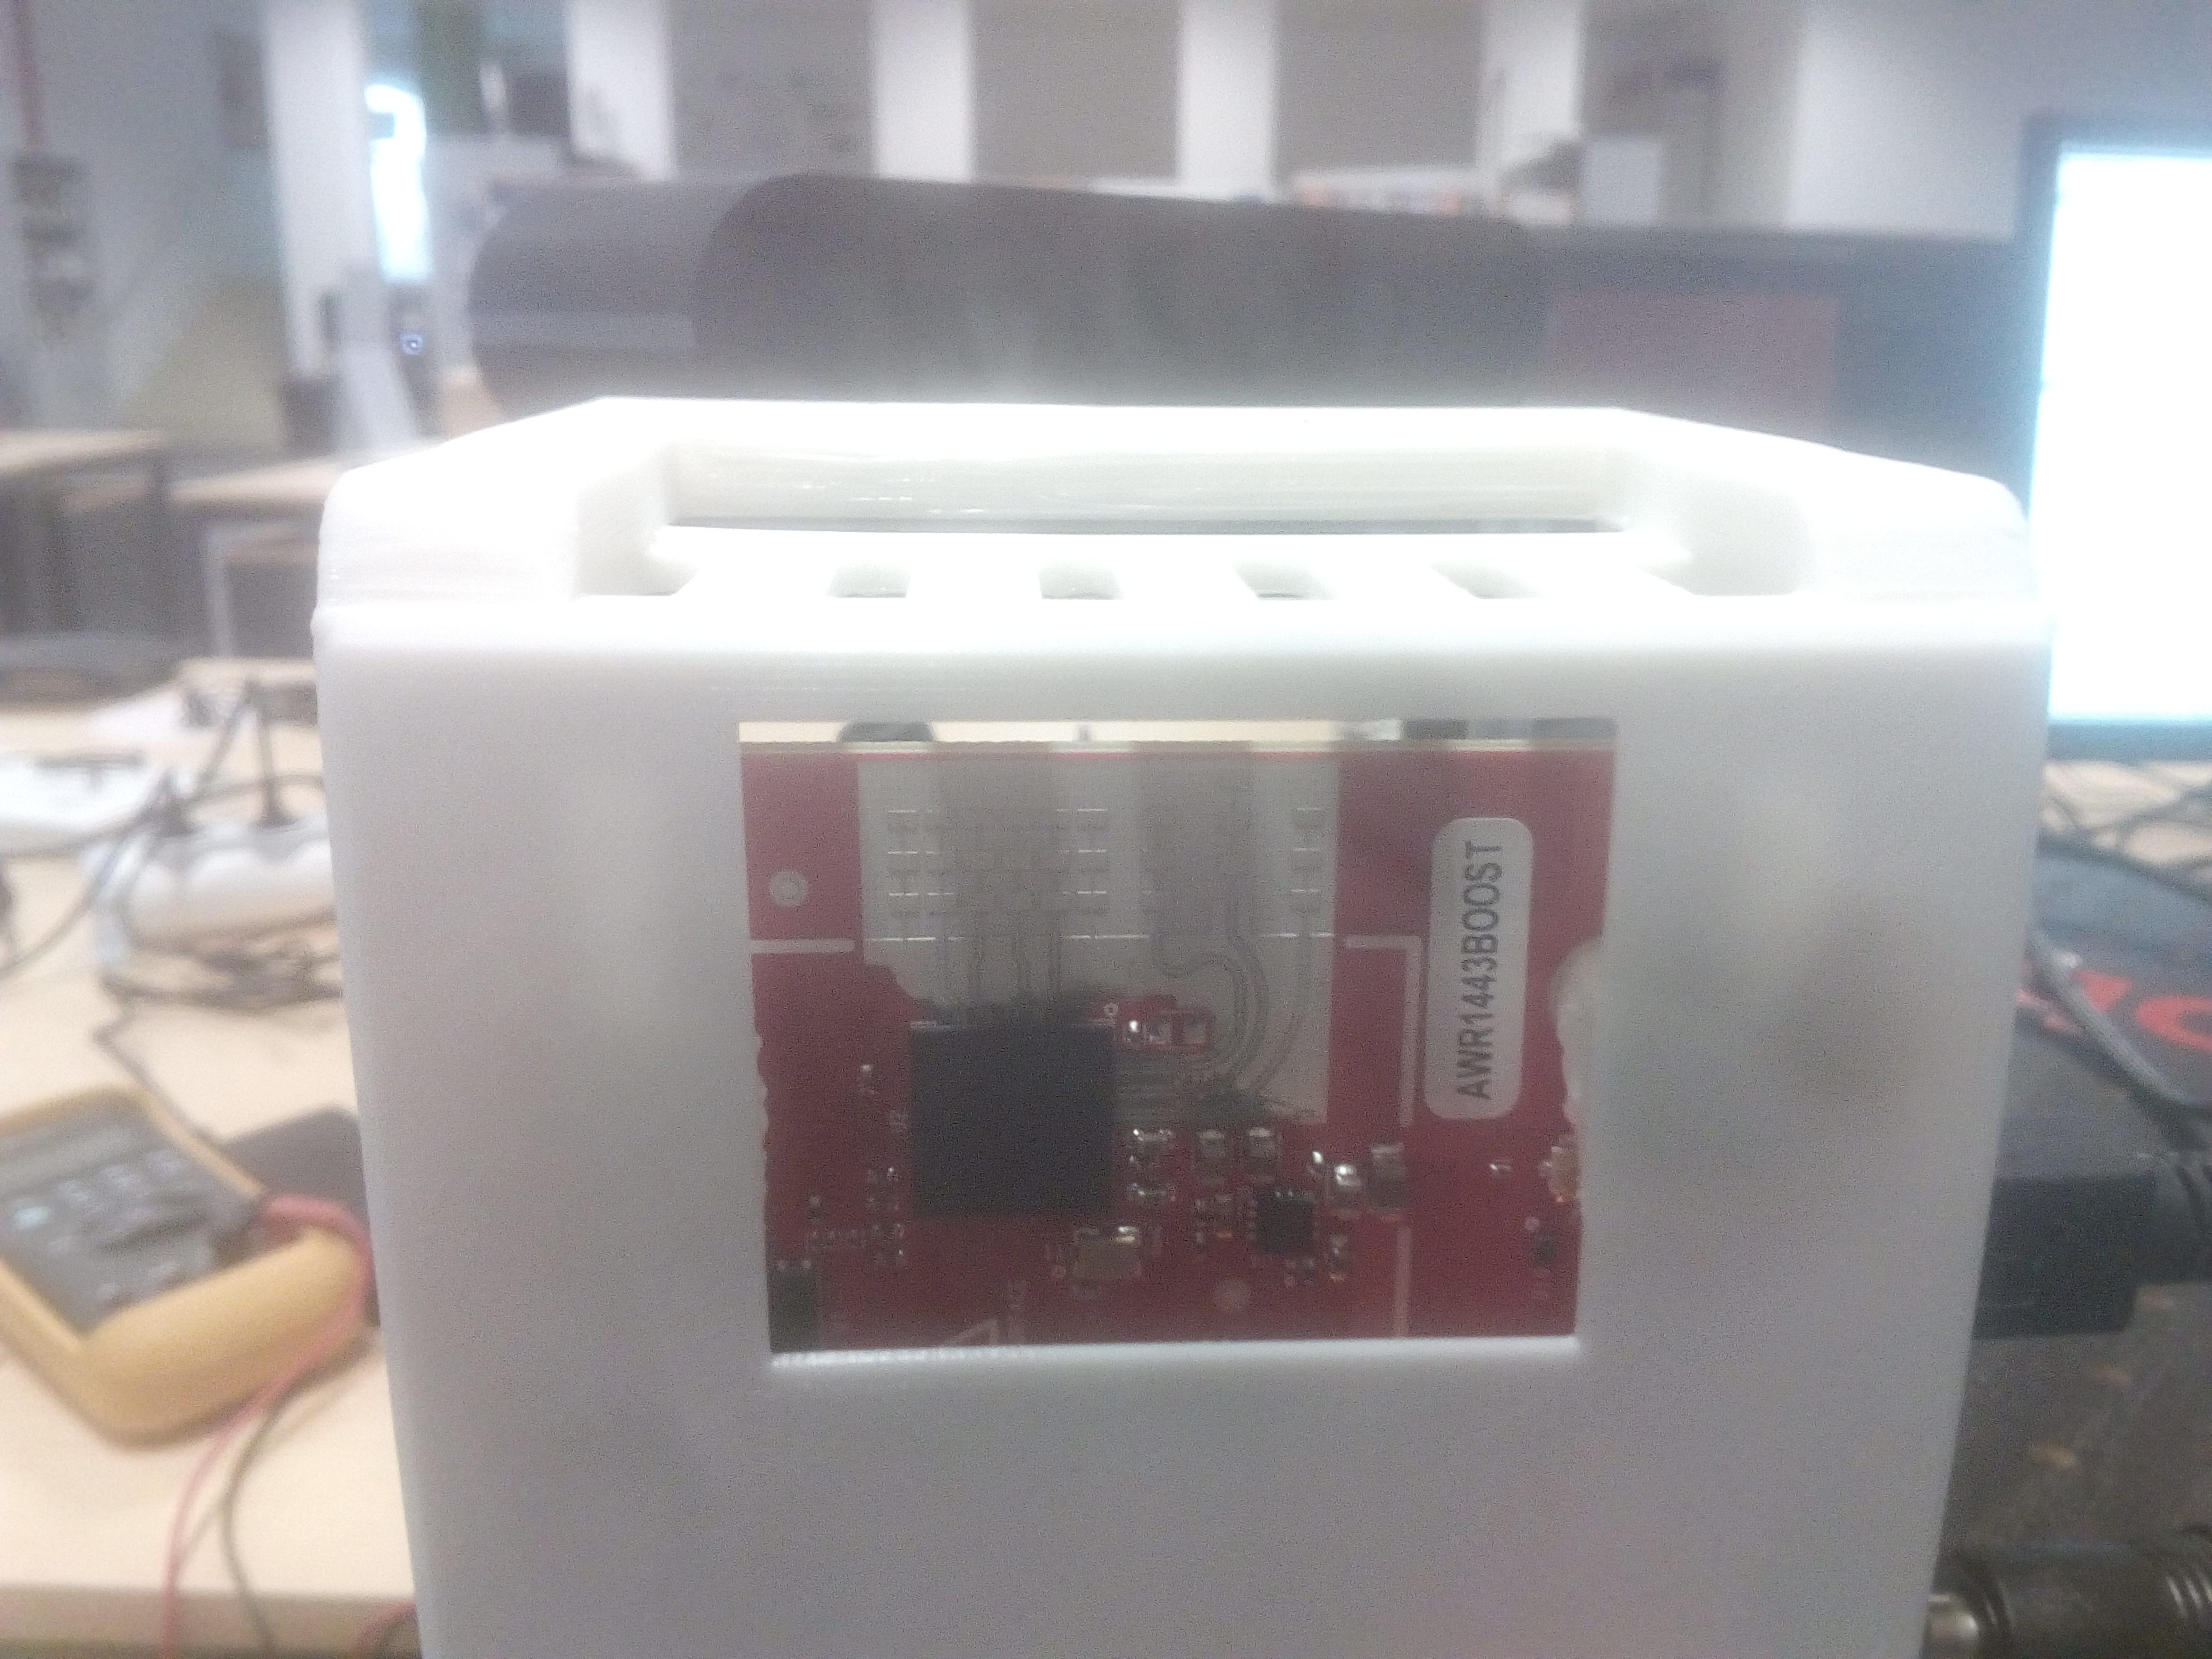
When using the board awr1443boost (sdk 1.2.0.5) with ROS, and representing the received point to RVIZ, I noticed that the points that should represent a flat surface across the elevation (z axis), appear to be curved as if it is detecting some kind of dome. To represent this points, the cartesian coordinates are used.

Is there any explanation to this phenomenon?

Best Regards,

Edgar

  • Hi,

    Firs you can identify if the (x,y,z) values represent the flat surface.

    It is possible that this appearance is produced by clutter

    thank you
    Cesar
  • Hi,

    Yes, they represent the flat surface.

    I am sending the pictures that illustrate the situation.

    This one with grey background is the representation in RVIZ, where the red axis is the Y, the green axis is the X and the blue axis the Z.

    This picture is a picture of the flat surface in front of the radar that is contained in the white box.

    Rest assured that the box is cut open in front of the antennas.

    Best Regards,

    Edgar

  • Hello,
    Can you please try the Out of Box demo and check the equivalent results.

    This will help us know if the device is reporting these values vs the visualizer adding conversion error.

    Thank you
    Vaibhav
  • Greetings,

    Using the Out of Box demo the results show a flat surface as expected. The question here is why this phenomena when using the mmwave ros package.

    Best Regards,
    Edgar
  • Hi Edgar,

    Points which are detected in the same range bin (i.e. at the same range) will appear to form a curved shape.

    1. Have you ensured that you are using the same profile configuration between the ROS Visualizer and the Out of box demo visualizer? You can find the profile configuration used by the ROS demo at ~/catkin_ws/src/ti_mmwave_rospkg/cfg/1443_3d.cfg.

    2. Also, peak grouping, which groups multiple neighboring points into one, is disabled in the profile config used in the ROS demo. This causes more points to be output on the ROS visualizer as compared to the OOB demo visualizer where Peak grouping is ENABLED by default. You can disable Peak grouping in the mmWave Demo Visualizer using the controls provided on the Real Time Tuning Tab. I would suggest you to use the ROS profile config with the OOB demo visualizer and compare the results.

    Regards
    -Nitin
  • Hi Nitin,

    I used the same configuration for both ROS Visualizer and OOB demo visualizer and disabled the peak grouping in both. Here in the lab we figured that the curved shape was somehow "compensated" by further processing in the OOB demo visualizer software and we did the compensation ourselves in the ROS in order to appear flat.

    Regards,
    Edgar