This thread has been locked.

If you have a related question, please click the "Ask a related question" button in the top right corner. The newly created question will be automatically linked to this question.

IWR1642: mmwave studio post proc fft result for velocity

Part Number: IWR1642

Hello,

I`m studying about radar processing by using captured raw data with DCA1000/IWR1642/Matlab environment.

First, I checked if my range fft is working or not by comparing with the result of mmwave studio post processing.

mmwave studio result for Rx1:


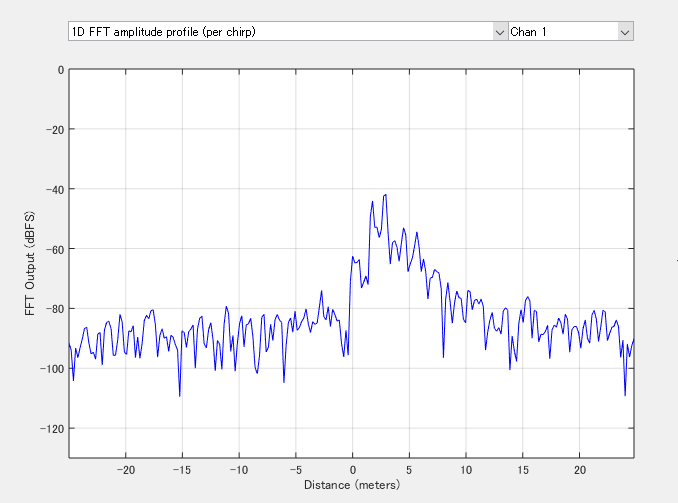
My matlab result for Rx1 (overriding all fft results for each chirp):

Ok, it looks fine.

Next, i checked about the velocity, but the result was unexpected.

Here is the result from mmwave studio:

As you see in the red circle, some deviations of velocity are seen. So i expected some fft peaks should be seen in each 2D fft result.

But my result looks like this:

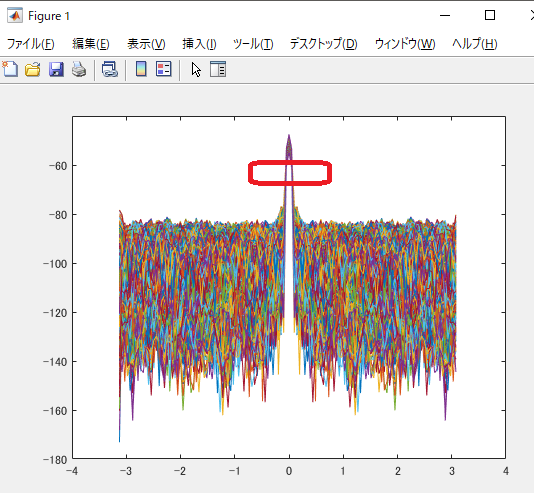
This is the result of 2D FFTs (The FFT has been applied in chirp wise against to the result of 1D FFTs).
I expected some peaks would be found in the above read circle, but i only see a single peak.

My question here is, can mmwave studio show each fft result for the velocity rather than the heatmap ?

Best Regards,
NK

  • Hello NK,

    All of the plots available through mmWave studio can be found in the drop-down menu in the post processing window.

    - Chloe

  • Hello Chloe,

    Thank you for your reply. Ok, you meant you don`t have the FFT plot for velocity in mmwave studio.

    I got the following result for faster moving object (fading away from the radar):

    And here is the result from mmwave studio:

    As you see, it looks similar.

    BUT, i actually got a symmetric plots: 

    by using the following pseudo code:

    fftOut = fftshift(fft(fftDataInChirpWiseHanned, nFFT_2D));
    plot(plotVelocityIndex, mag2db(abs(fftOut) - correctFactor_2D);

    Because the object is fading away from the radar, i think i should get positive velocity deviations in the plot. But as you see, i got negative deviation. 
    If I did plot(plotVelocityIndex, mag2db(abs(fliplr(fftOut))) - correctFactor_2D); in the code, i got the first plots and looked matches the result of mmwave studio.
    I`m not very sure if this is expected or not. Could you please comment ?

    Best Regards,
    NK

  • Hi, NK:

    Your understanding is correct, that we should expect to see a positive Doppler if the target moving away from radar sensor. I am not sure why your post processing shows the different. Maybe you can check your FFT input, and make sure it is only one dimension. And you did not do any conjugate operation accidentally.

    Best,
    Zigang
  • Hello, Zigang

    Thank you for your comment. Oh, that was my fault. As you suggest, i make conjugate operation wrongly. Now i could the correct Doppler deviation. I close the thread now.

    Best Regards,
    NK

  • Hello, Zigang

    Sorry, can i ask you one more thing ?
    Now i have range power spectrum in 1D_array[number of ADC samples] for each Rx, frame, and chirp. And also i have doppler power spectrum in 2D_array[number of chirp per frame] for each.Rx, frame, and ADC Samples.

    If I`m focusing on Rx1 and Frame1, I actually have
    - 1D_array[number of ADC samples] x number of chirp
    - 2D_array[number of chirp per frame] x number of ADC sample

    And when i want to draw a graph having
    - X axis = doppler
    - Y axis = range
    - Z axis = power spectrum,
    how i should get the power spectrum for Z axis from 1D_array (s) and 2D_array(s) ? Is there any specific formula ?

    Best Regards,
    NK
  • Hi, NK:

    I am using MATLAB, and you can use function "mesh" to plot the 2D spectrum function.   You can also use function "imagesc" to plot the heatmap as shown in the radar Studio.

    Best,

    Zgang