


Other Parts Discussed in Thread: DCA1000EVM
Recently, I used the DCA1000EVM to collect ADC raw data from my device while simultaneously extracting the UART point cloud that the device generated. I placed an object about 1.5m away from the device and was successfully able to identify this object with both the UART point cloud and by doing 1D FFT on the ADC data that I extracted from the device via LVDS. However, I wanted to make sure the velocity and angle were similar to the UART point cloud as well, so I took a 2D FFT at the range bin where there was an object (in this case range bin 34) and it produced the following graph:
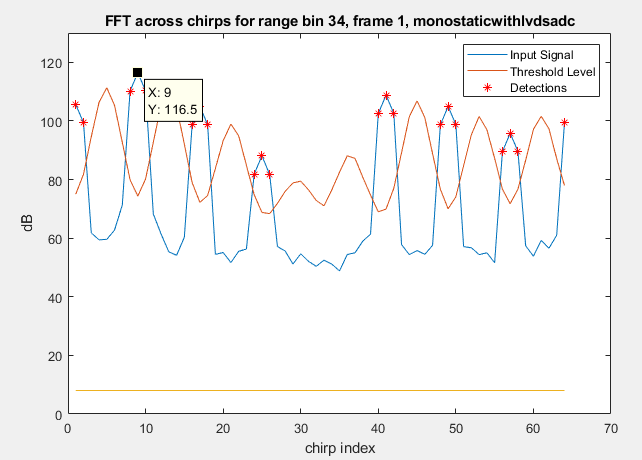
I am plotting the threshold level of CFAR-CA with 15dB threshold scale, wrapped noise window, a noise window length of 4, a guard window length of 2, and a divShift of 3. I don't understand why the velocity FFT looks like this because nothing was moving when I captured the data. What is even stranger is that this occurs in other tests where I have done the same thing; it is something I can replicate in test after test. All of the peaks are an even 8 bin spaced apart: [1 9 17 24] for the positive velocities and [64 57 49 41] for the negative velocities. The UART point cloud only has velocity detections at bins 1, 2 and 64. Have you seen this phenomenon before? If so, what is the proper way to correct for it?
