Other Parts Discussed in Thread: IWR1642
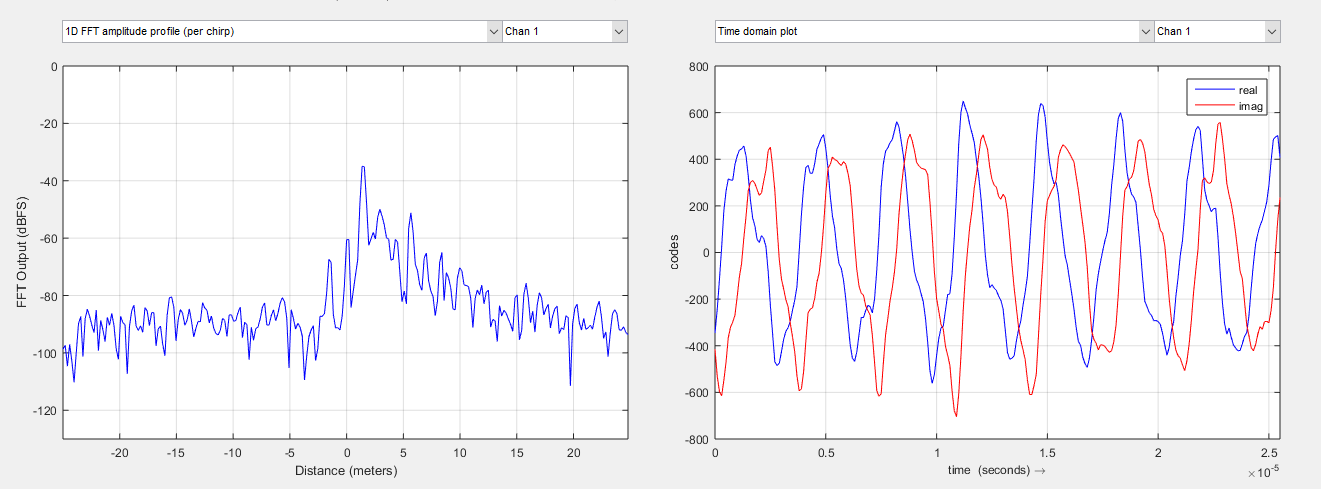
Using the DCA1000EVM to collect the ADC data of the IWR1642, the 1D FFT amplitude profile (per chirp) image can be obtained in the radar postprocessing interface of mmwave studio. How can the Distance (meters) parameter of the abscissa be obtained as shown in the figure below? What is the principle? Is there a formula to calculate this distance parameter? Is it configured when configuring mmwave studio? If so, which parameter is it related to? It would be nice if I could tell me how to get this diagram by matlab using adc data. Thank you