This thread has been locked.

If you have a related question, please click the "Ask a related question" button in the top right corner. The newly created question will be automatically linked to this question.

IWR6843ISK: OOB Demo Data Format

Part Number: IWR6843ISK

Hi,

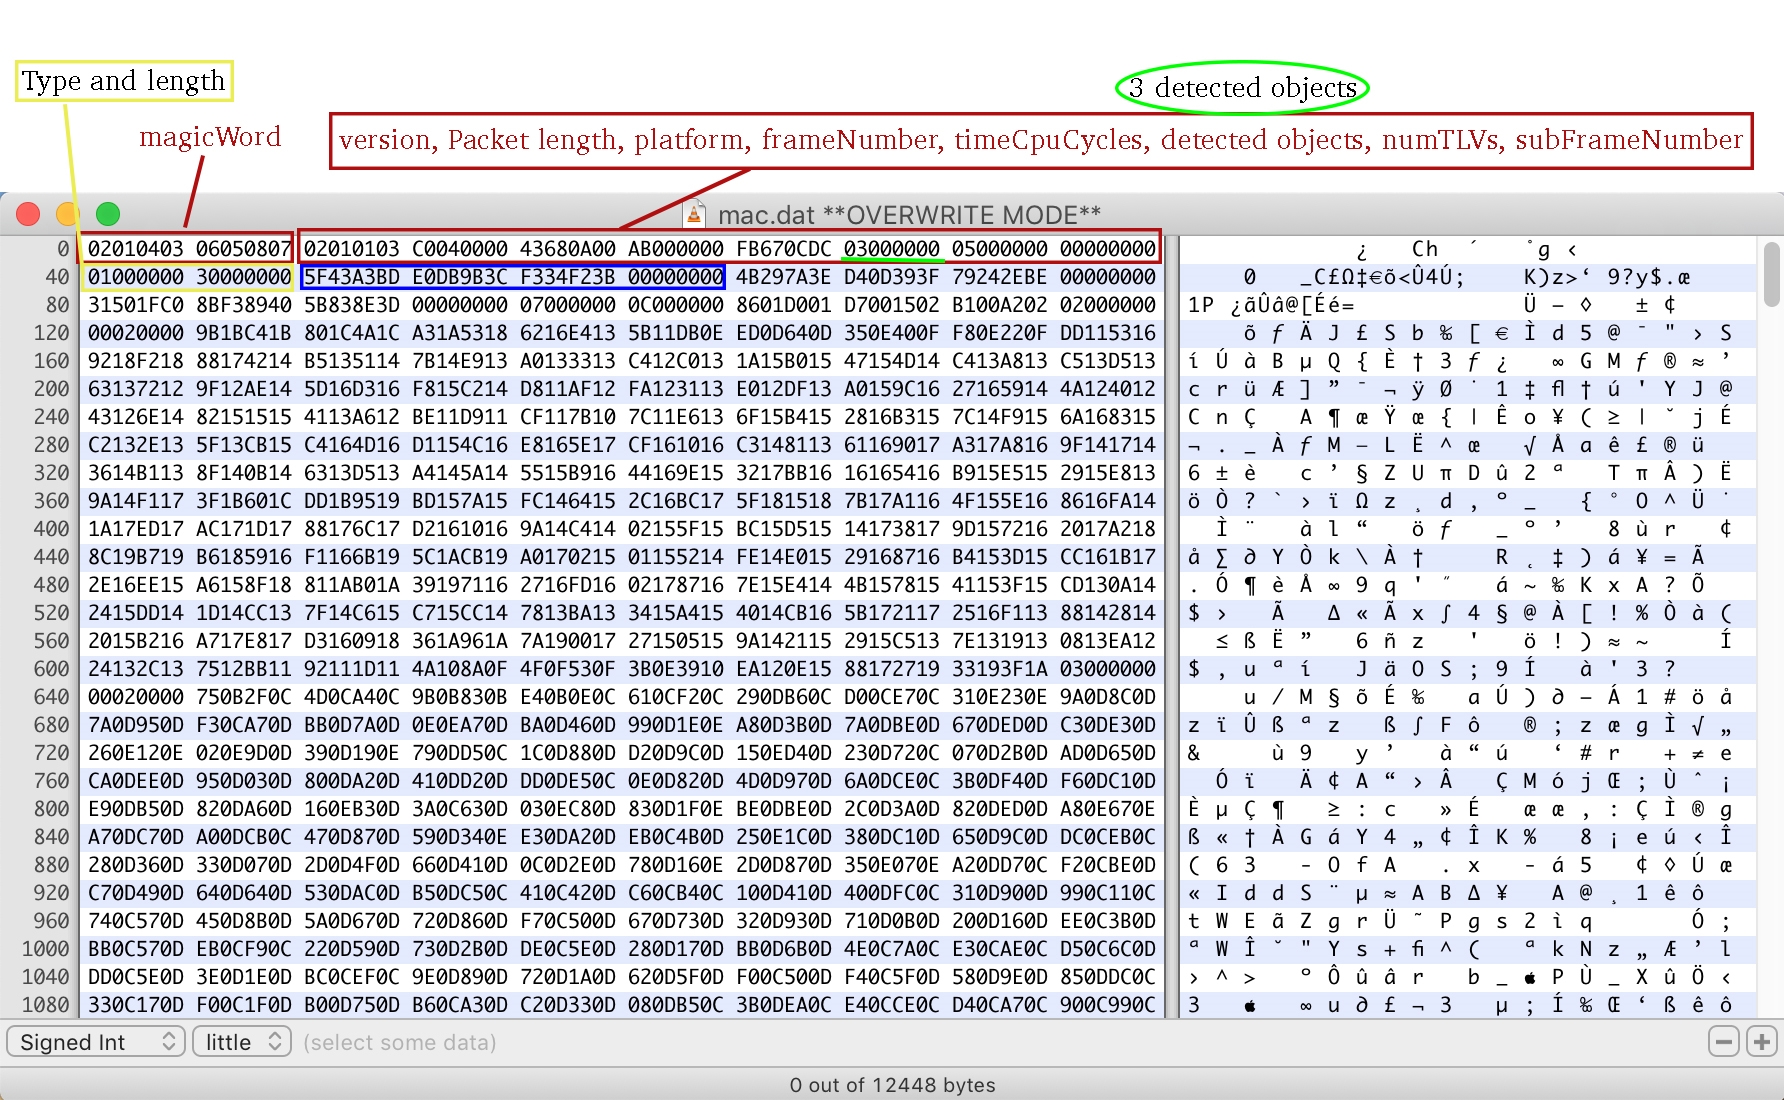
I'm trying to parse the OOB Demo .dat file and I'm having this problem where all my coordinates (x, y and z) values are zeros and that's because of the huge value of xyzQFormat, I tried recording the .dat multiple times and used different PCs but it's always the same value 48547. Same thing with the # Detected Objects value (in the descriptor section) which always gives a value of 17247. As you can see in the photo below, I'm highlighting the # Detected Object and xyzQFormat.

My understand is that the equation to calculate a coordinate in meter would be; x in meter = x / (2 ^xyzQFormat), please correct me if I'm wrong. If this equation is correct then it impossible to get a reasonable x value when xyzQFormat is this huge, right?

Please let me know if these two values make sense.

Thanks in Advance,

Yaser 

  • Hi Yaser,

    I'm not sure if you're looking at the right documentation to decode the data stream. 

    The point cloud output format is documented in the out of box demo doxygen documentation available in the SDK at:

    C:\ti\mmwave_sdk_03_01_01_02\packages\ti\demo\xwr68xx\mmw\docs\doxygen\html\index.html

    file:///C:/ti/mmwave_sdk_03_01_01_02/packages/ti/datapath/dpu/rangeproc/docs/doxygen/html/struct_d_p_i_f___point_cloud_cartesian__t.html

    Please go through the doxygen to understand the UART data format.

    You can also download the mmWaveDemoVisualizer source code as shown in the following thread and refer to the function process1 in mmWave.js to understand the parsing.

    https://e2e.ti.com/support/sensors/f/1023/p/729467/2692336#2692336

    Regards

    -Nitin

  • Hi Nitin,

    I've actually looked at those files already, the thing is there don't really have much in terms of explaining the output data structure. For example, when I look at the index file (see screenshot below) it only refers to the struct_d_p_i_f___point_cloud_cartesian__t.html.

    Then when I check the Point Cloud file I can only see that it says coordinates are in meters (see screenshot below).

    So I'm not sure how can I come up with a formula to parse the MSG Detected Points by looking at those two files only. I did look at mmWave.js and this is what I found:

        for (i = 0; i < numDetecObj; i++)  
        {
            /*start index in bytevec for this detected obj*/
            startIdx = vecIdx + i*sizeObj;
    
            x_coord[i] = getFloat(vec[startIdx + 0],  vec[startIdx + 1],  vec[startIdx + 2],  vec[startIdx + 3]);
            y_coord[i] = getFloat(vec[startIdx + 4],  vec[startIdx + 5],  vec[startIdx + 6],  vec[startIdx + 7]);
            z_coord[i] = getFloat(vec[startIdx + 8],  vec[startIdx + 9],  vec[startIdx + 10], vec[startIdx + 11]);
            doppler[i] = getFloat(vec[startIdx + 12], vec[startIdx + 13], vec[startIdx + 14], vec[startIdx + 15]);
        }

    But this doesn't show to calculate the coordinate in meters. Can you please point me to where I could find an answer to that. And if I there a direct Demo data structure guide like the one you guys provided for xWR14xx/xWR16xx users.


    Many thanks,

    Yaser

  • Any help on this one please..
  • You are mixing up SDK 2.1 with SDK 3.x formats, they are different. As you can read from the documentation you yourself quoted, the x,y, and z are in float and directly in meters, so no Qformat is needed [in 2.x they were in fixed point and Qformat applied for them]. Each floating point number is 4 bytes by the standard definition of float. So you need to parse the data into floating point numbers in the order indicated in the structures. The output data structure format is described in sufficient detail in the doxygen to be able to parse the data, can you point to specifically what you don't understand in the document?
  • Hi,

    I got that Qformat point when Nitin replied to me earlier, but thanks for mentioning that. Anyway, the packet header structure is very clear and I know that it is 40 bytes in size, then we have the TLV header (which contains Type and Length) with a size of 8 bytes. To me, it gets confusing from this point. If you look at the screenshot below, the yellow rectangle shows the Type and Length (Type =1, Length= 30), Type 1 refers to MSG_DETECTED_POINTS therefore it contains (x, y, z and velocity values). Now if you look at the blue rectangle down there, those values don't make sense, and they keep repeating every time I recorded data. Or am I not following the structure correctly?

  • Why don't the blue box numbers make sense to you? What do you expect there?
  • When I parse the numbers in the blue box I got the following:

    x= -7.97, y= 1.9, z= 7.39

    As we have 3 detected objects in total, the other 2 objects coordinates are;

    2nd point: x= 2.4, y= 7.2, z= -1.7

    3rd point: x= -2.4, y= 4.3, z= -6.9

    So every time I use MATLAB to create a 3D Scatter plot and compare my results with the OBB Demo 3D Scatter plot they never match, as shown below. One last thing is that I always get the same x value for the first detected point (5F43A3BD).

  • Your data and plots are not consistent. You show for example x = -7.97 for the first point but I don't see it in either plot. Also, how did you parse the hex number of x = -7.97? The hex to float for the hex value corresponding to x is -0.079 meters so it seems you quoted in terms of cm, not m? The 3D scatter plot shows axes in meters but Figure 1 does not show any units. Please clarify your response.
  • You are right! I didn't convert it correctly, it makes more sense now. The first 2 points look identical to the OBB Demo scatter.

    Point 1= (x=-0.0797, y=0.019, z=0.007);

    Point 2= (x=0.244, y=0.722, z=-0.17);

    Point 3= (x=-2.48, y=4.31, z=0.069);