Hi,
I have attached a couple of images with plotted data. The data was collected in a controlled environment using a corner reflector traveling at a fixed speed on a track. The corner reflector travels along the track from one one to the other and then returns. The images contains data collected from a iwr1443 sensor. The data is:
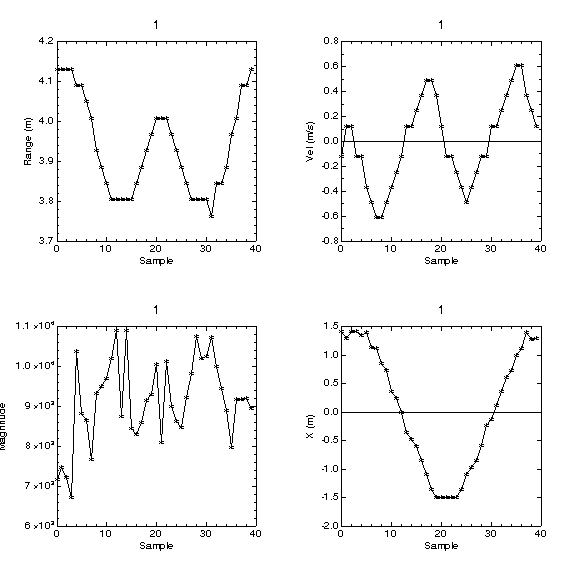
Peak fft value from dataPathObj->rangeDopplerLogMagMatrix
Range distance from the dataPathObj->dataPathObj->rangeDopplerLogMagMatrix index where the peak occurred
Velocity from dataPathObj->objOut[idx1].peakVal where idx1 corresponds to the largest value in dataPathObj->objOut[idx1].peakVal
X distance from dataPathObj->objOut[idx1].x where idx1 corresponds to the largest value in dataPathObj->objOut[idx1].peakVal
Image_0.gif has data that is very reasonable. Image_1.gif has noise in it with the same environment and program.
1. Any thoughts on why the noise is present in one an not the other?
2. Between samples 20-26 the range and velocity data is corrupted but not the x distance data. Also the x distance data has a spike at sample 17 with no apparent problem in the range velocity data.
Any thoughts on why data for one parameter could be corrupted but not others for the sample sample point?
3. I am surprised that the peak magnitude data is not "smoother" but has a very irregular behavior from sample to sample. Image meas_1 has regions of smoother data. Any thoughts?
4. My final question is that the sample location where the velocity and x distance crosses zero is one off. I would have thought that this would have occurred at the same sample point. Any thoughts?
Thanks.
Al