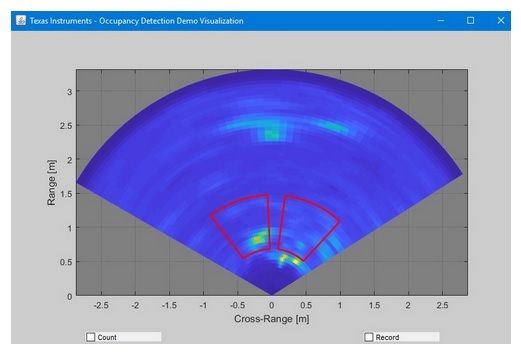
I ran the Vehicle Occupancy Detection lab and obtained some readings, which i also saved to a .m file when I clicked record to save the heatmaps. A screen shot is displayed in the first figure below
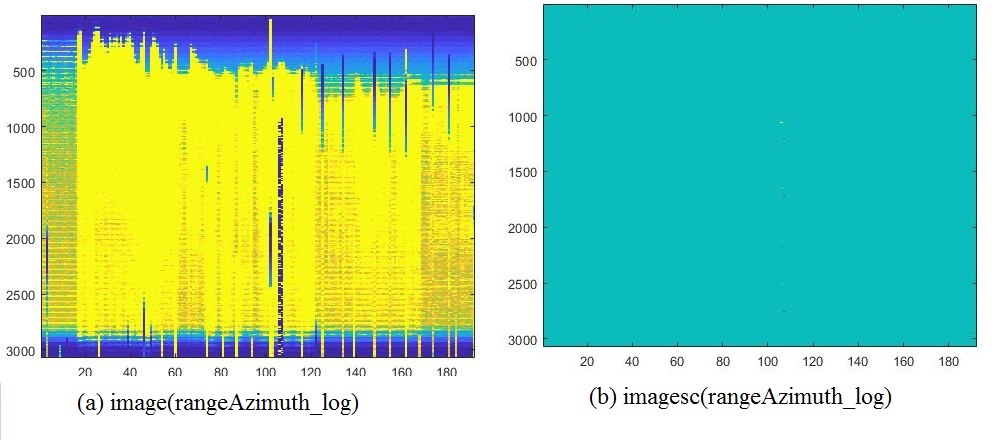
The saved file can be opened in matlab and is basically a 2D matrix of floats. However, when I try to view the matrix using matlab commands imagesc(rangeAzimuth_log) and image(rangeAzimuth_log), I get the plots below - which are not in any way close to the one computed in the gui.
How can I open the saved file to view a plot like the shown in the first diagram?


