


Tool/software: Code Composer Studio
Hello Support Team !
I'm currently working with the Area Scanner Project with my own visualizer and I have some issues. I hope you could help me to understand those:
- When plotting data from mmWave sensors I always have some "ghost points" which are out of the FoV of the sensor (see image below). Blue lines are limits of sensor FoV a d "ghost points" are around 11m along X axis.
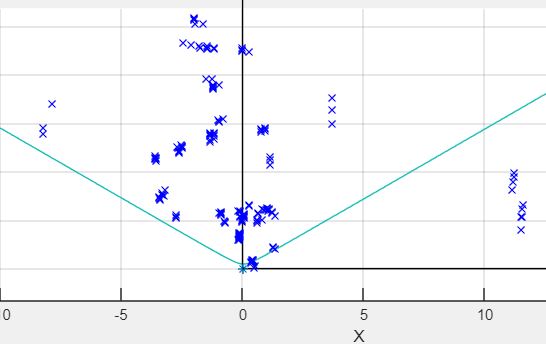
Where those points can come from ? Do I have to remove them "manually" with a "if" in my visualizer ?
- When testing the project I can't see objects further than 10 meters. Does this limit come from the config (profilCfg or cfarFovCfg) or does a limit is hardwritten in area scanner project ?
Here is my config :
sensorStop
flushCfg
dfeDataOutputMode 1
channelCfg 15 7 0
adcCfg 2 1
adcbufCfg -1 0 1 1 1
lowPower 0 1
profileCfg 0 60.25 7 3 24 0 0 156 1 256 12500 0 0 30
chirpCfg 0 0 0 0 0 0 0 1
chirpCfg 1 1 0 0 0 0 0 4
chirpCfg 2 2 0 0 0 0 0 2
frameCfg 0 2 32 0 100 1 0
guiMonitor -1 1 1 1 0 0 1
cfarCfg -1 0 2 8 4 3 0 600 0
cfarCfg -1 1 0 4 2 3 1 1400 0
multiObjBeamForming -1 1 0.5
calibDcRangeSig -1 0 -5 8 256
clutterRemoval -1 0
compRangeBiasAndRxChanPhase 0.0 1 0 1 0 1 0 1 0 1 0 1 0 1 0 1 0 1 0 1 0 1 0 1 0
measureRangeBiasAndRxChanPhase 0 1. 0.2
aoaFovCfg -1 -90 90 -90 90
cfarFovCfg -1 0 0.25 60
cfarFovCfg -1 1 -10. 10
sensorStart
Thanks a lot for your help !
Have a nice day,
Quentin Bajot.
