


Hi,
Good day.
I am posting on behalf of one of my customer. He is using an mmWave Demo Visualizer 3.1.0 and have some questions:
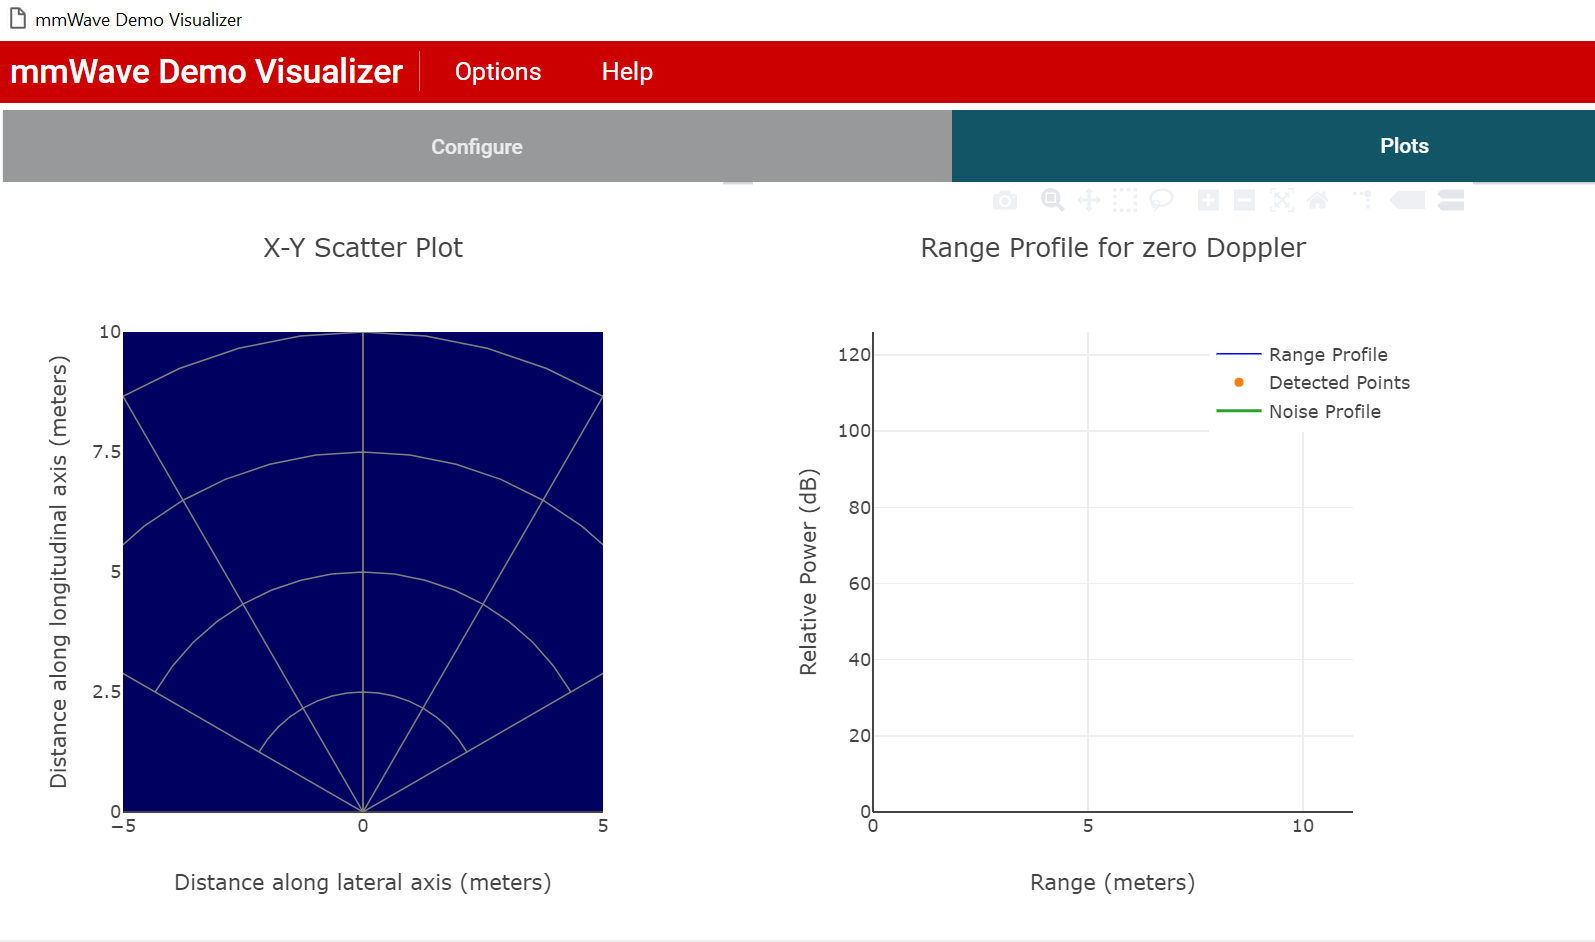
1). In the plotting of "range profile for zero doppler", the y-axis, relative power, How does this value work out?
2). Where can I find the reference code of mmWave_Demo_Visualizer 3.1.0.
I have attached the screenshot of his issue: "visualizer_exp.png"
Hope you could help with his inquiry. Appreciate your support on this.
Thanks in advance.
Art
