


Hi together,
with the mem_capture test of SDK v.2.1 (LTS), I took some frames of raw data out of the gDataCube which I wanted to process further using own algorithms. For reading in the data, transforming it into a complex baseband signal and performing the 1D-Range FFT, I used the MATLAB script capture_demo.m which was provided by TI in SDK v.1.01.00.02 for the Capture Demo.
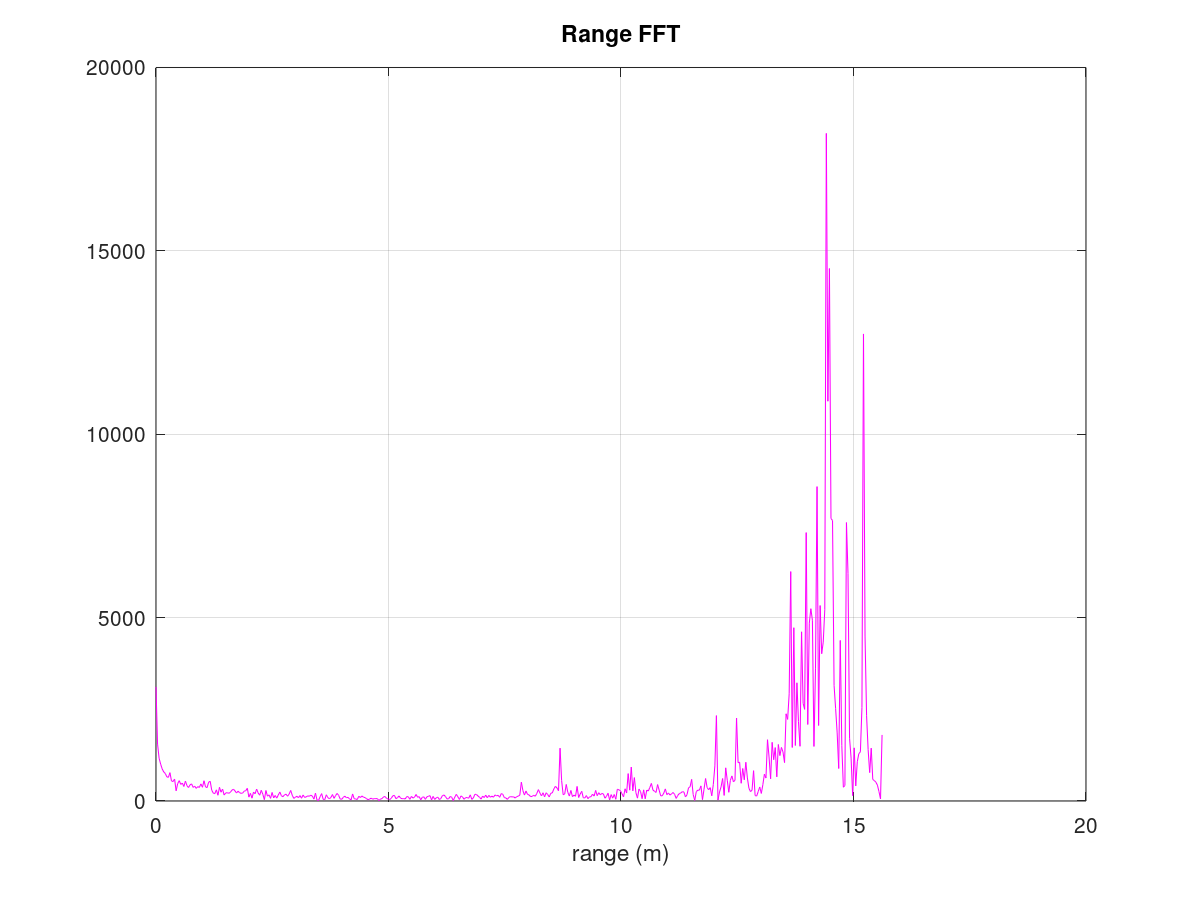

Plotting the result and comparing it with the range profile of the Demo Visualizer (from SDK 2.1), I noticed a strange scaling in range which seems to be non-linear. Note how the first real peak (which corresponds to a physically real object in the scene) in the Visualizer's plot has about 45% of the range of the globally largest peak. However, in the MATLAB plot obtained directly from raw data, there seems to be no object up to the first 65% of the globally largest peak.
Additionally, the unit-scale of the abscissa seems to be off (the real distances are the same as the ones displayed in the Visualizer's plot) despite having changed all parameters of the script accordingly to the chirp parameters used in my measuring process, namely
- Number of ADC samples per chirp: 470
- Number of chirps: 11
- Slope constant: 24 MHz/usec
- ADC sampling rate: 10000
- ADC start time: 6 usec
Note that I changed the chirp parameters of the mem_capture test from the default ones to match them my scenery and the configuration used in the Visualizer.
Can you tell me what's going on here? How can I get a correct range FFT out of the raw data?
