This thread has been locked.

If you have a related question, please click the "Ask a related question" button in the top right corner. The newly created question will be automatically linked to this question.

HDC2080EVM: HDC2080EVM

Part Number: HDC2080EVM

Hello,

Recently I have started using the HDC2080EMV. I am trying to measure Humidity and Temperature of a IPC placed in climate chamber. I am using the GUI to stream the data, but I noticed that the Temperature measurements are accurate, while the humidity has offset of approximately 20%. Could it be because of the climate chamber or is something wrong with the GUI settings. Thank you in advance.

Best regards,

Petar

  • Dear Petar - 

    20% off is significant, thanks for coming here and asking your question. (is up + or -?)

    What are the conditions of the chamber (chamber set point, reference measurement) and/or do you have any pictures of the measurement that you could share here?

    Has the EVM (to your knowledge) been exposed to any chemicals or been washed? 

    What did you set the EVM up for? (This should not be the reason for the large deviation, though)

  • Thank you for the fast response. 

    I do have graph of the test. The measurement is showing offset of between +10% and +20%.

    Regarding the sensor, I believe it was not exposed to any external damage factors.

    Best regards,

    Petar

  • Petar - 

    thanks - looks like you added your setpoints to the graph  - how did you time align the reference to the EVM output? How long did you run this test for?

    any chance you could show or send the log from the GUI?  

    Would be by default be here: C:\ti\Sensing Solutions EVM GUI-1.10.0\PC GUI\yourfilename.csv, need to choose to do that when streaming from the GUI. 

    Here below i show less than 2 seconds of data, in office environment, from HDC2080EVM

    And a resulting graph from opening the csv in excel and plotting temp and %RH as you did

  • Dear Josh,

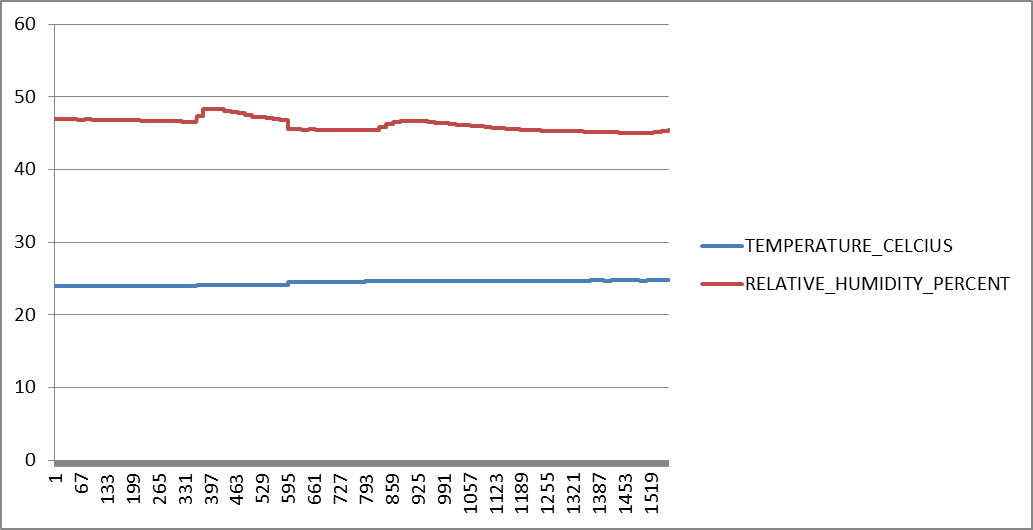
    The two pictures below are of the recorded data and the Excel representation of a test outside of the chamber.

    As you can see, both graphs are the same. In my current case I have accurate temperature, but the humidity has an offset of around +10%. The value of +20% was wrong, I apologize. Unfortunately I Cannot include a picture of the climate chamber screen, however even during the live stream the same error appears (+10% offset). Meaning that the problem is not the graph but the received values.

  • Petar - 

    sorry for the delay - I think something must be physically wrong with the EVM - i can see it cycling to 0 and back up, please request replacement via the disty you worked with to get this one. Please advise if you run into any trouble with that.