This thread has been locked.

If you have a related question, please click the "Ask a related question" button in the top right corner. The newly created question will be automatically linked to this question.

IWR1443BOOST: ADC data

Part Number: IWR1443BOOST
Other Parts Discussed in Thread: IWR1443

Hi team,

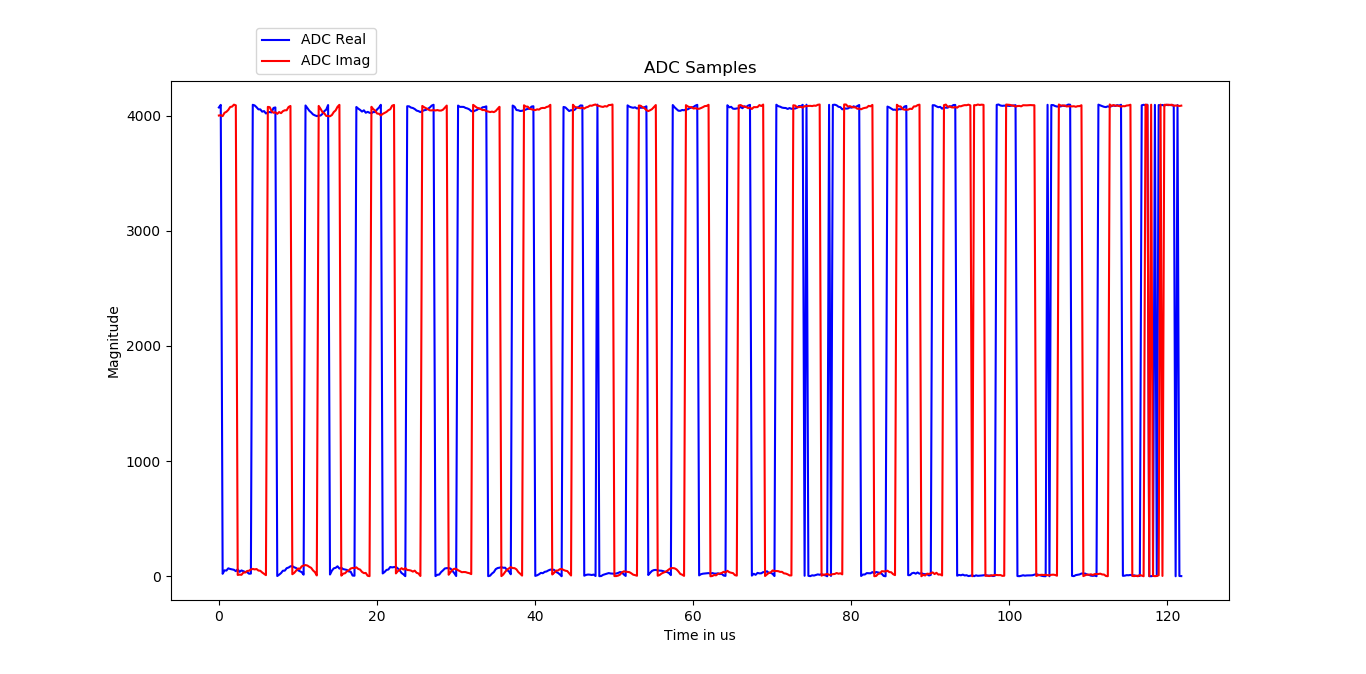
I obtained ADC data. Plot of data is attached below. I expected the data to be like a sine wave but as shown below its having square wave shape.

Is any filtering applied to IF frequency before giving to ADC.  


Thanks,

Akshay

  • Akshay,

        It appears that data shows only positive values, ADC data will be in 2s compliment format, Around zero you will have swing on either side.

    You could refer to below app-note for interpreting the data, it has sample matlab code for reference as well.

    http://www.ti.com/lit/an/swra581b/swra581b.pdf

    Thanks and regards,

    CHETHAN KUMAR Y.B. 

  • Hi Chethan,

    I plotted data after taking 2's complement and obtained below graph. Now it looks line a sinusoidal signal.

    Please confirm if data is as expected.

    Thanks,

    Akshay

  • Akshay,

        It appears that above problem has been fixed, It would be hard to comment by just looking at the time domain plot, without knowing what is front of the radar and environment it is seeing.

      However with this you should be able to proceed for the further Analysis. 

    Thanks and regards,

    CHETHAN KUMAR Y.B.

  • Hi Chethan,

    I am using high accuracy FW with profile_2db configuration. I obtained ADC data from M0 memory.

    I calculated FFT from received data and compared it with FFT of IWR1443. I got below graphs. Peaks from both FFT matches each other, but there are locations where peak from both FFT are not different.

    Below graph both peak matches each other:    

    In below 3 plots, peaks position relative strength does not match:

    Due to mismatch in FFT data, I am worried if the ADC data is correct or not.

    Thanks,

    Akshay

  • Akshay,

        For calibration purpose you need keep a strong object (Typically corner reflector in front of  Radar), And no other objects reflecting in front of it, And compare the two results.

    Also,  we need to understand the difference between the configuration difference between Python FFT computation and hardware accelerator FFT configuration. 

    Also could you elaborate difference between first graph and rest of the graphs. 

    For example difference could be window function used in the FFT could be different, number of FFT points could be different etc. 

    Thanks and regards,

    CHETHAN KUMAR Y.B.

  • Hi Chethan,

    I am using stationary copper plate as a reflector. Above graphs are obtained from this setup.

    There would be a difference between python FFT and hardware accelerator FFT. Floating point precision is much higher in python FFT computed in computer microprocessor.

    Setup for all the graph is same. Only difference is I slightly moved sensor

    I have checked windowing is not used in both high accuracy FW and python, number of FFT points are also same.

    So, can we conclude that ADC data is correct and difference in FFT output is due to difference of FFT processing in python and hardware accelerator.

    Thanks,

    Akshay

  • Akshay,

          If the scene (What Radar Antennas sees) changed or EVM has moved spectrum would change in non-controlled atmosphere. It appears  that ADC output is correct. You could proceed with further post processing. 

    Thanks and regards,

    CHETHAN KUMAR Y.B.