This thread has been locked.

If you have a related question, please click the "Ask a related question" button in the top right corner. The newly created question will be automatically linked to this question.

IWR6843ISK-ODS: How are 3D plot found in zone occupancy detection lab?

Part Number: IWR6843ISK-ODS

Hello.

I’m trying to plot the 3D scatter of moving object using data captured using IWR6843ODS+ DCA1000 just like

http://dev.ti.com/tirex/content/mmwave_industrial_toolbox_2_5_0/labs/lab0016_zone_occ_14xx/docs/zone_occ_14xx_user_guide.html

and I have some question.


How does the 3D position of the scatter were found from 2D projections of objects?

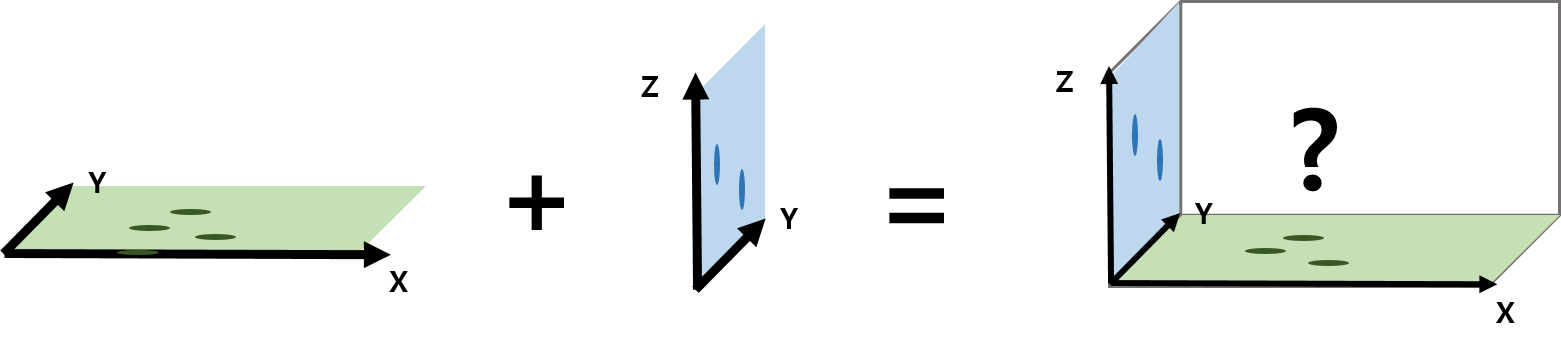
From what I understand, the range-azimuth heat map will give XY-plane point cloud and the range-elevation heat map will give YZ-plane point cloud.

In many cases, the number of points detected in these two planes will be different

and matching YZ-plane point cloud and XY-plane point cloud only using Y position seems to be difficult.

I don’t know how to get XYZ point cloud from two 2D point clouds.


  • Former Member
    0 Former Member

    Hello,

    3D point clouds are determined from performing angle of arrival estimation on the azimuth and elevation planes. With range, elevation angle, and azimuth angle - a 3D point cloud is arrived. 

    Since you are using a DCA1000 for raw data capture you will have to implement your own code for processing the collected ADC data to extract a 3D point cloud. I would recommend studying the source code of the ODS point cloud demo.

    Amanda

  • I still can’t understand how to reconstruct 3D point cloud from range-azimuth angle information and range-elevation angle information.

    Does the demo assume that the 2 points in 2D planes (range-azimuth and range-elevation) with the same radius are a projection of the same point in 3D?

    Also, could you tell me where the source code is? I can't find it.

    Thank you!

  • I found the code. Thank you!