


Other Parts Discussed in Thread: AWR1642
Hi!
I am trying to output the time domain plot from the data collected using AWR1642 and TSW1400. I managed to get the raw ADC data using the code on page 19/20 on https://www.ti.com/lit/an/swra581b/swra581b.pdf. However, I am lost at the time scale which should be used when plotting the raw data.
Given the following settings in Radar Studio,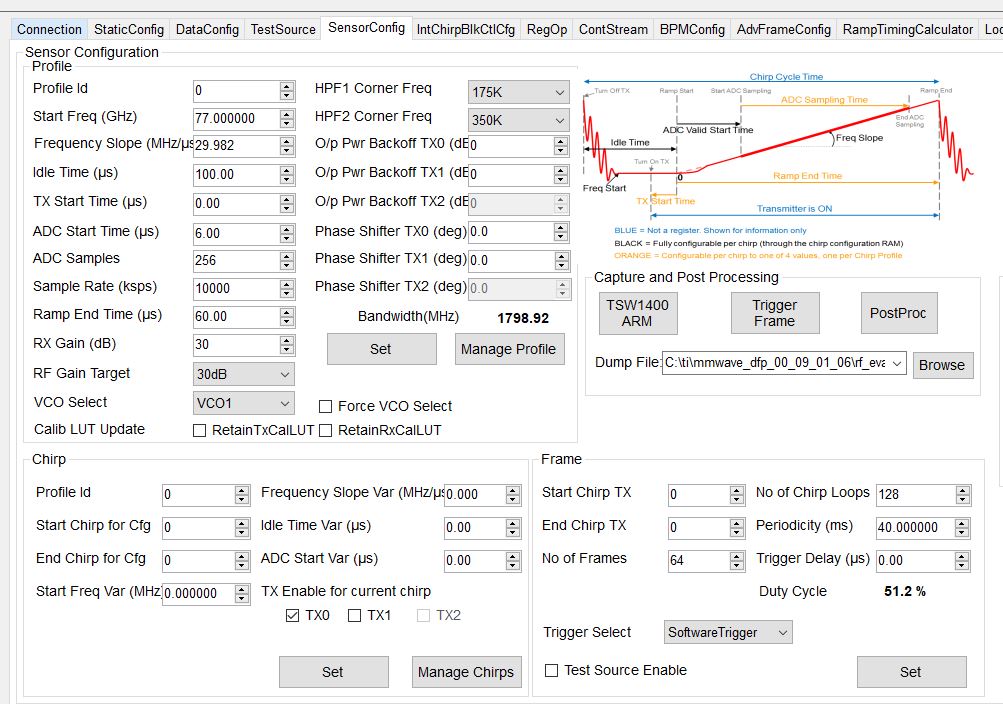
Which of the following (if any is correct) should be the time between each data:
1. period / (number of chirp loops * ADC samples)
2. ramp end time / ADC data
3. 1 / sampling rate
If it is not any of these, may I know what equation I should use then?
Also, what is the difference between ADC Samples and Sample Rate?
Thank you!
Regards,
Bao Wei
