


Hi
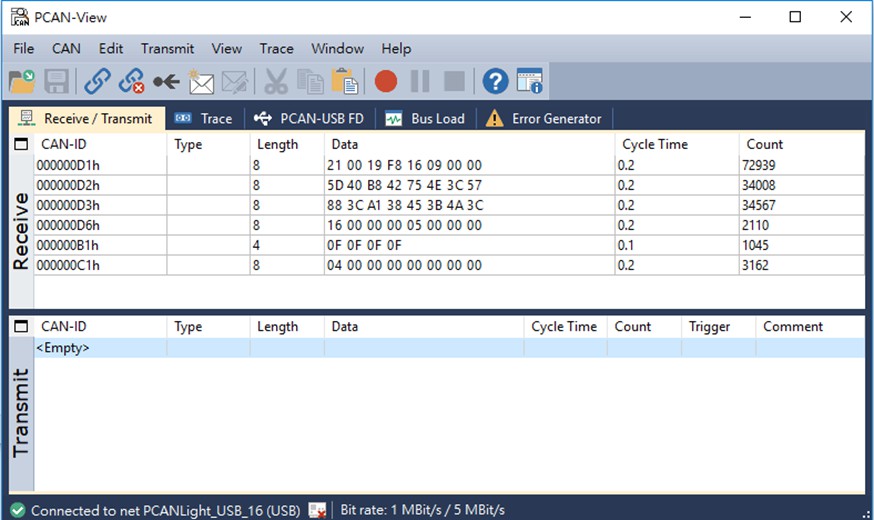
I got the CAN signal from PCAN-USB, like the following diagram:
What is the meaning of each CAN-ID and how to interpret the data to a value in meter ex: (X,Y) = (6m, 25m)?
BR,
Matt
Hi
I got the CAN signal from PCAN-USB, like the following diagram:
What is the meaning of each CAN-ID and how to interpret the data to a value in meter ex: (X,Y) = (6m, 25m)?
BR,
Matt
