I use FDC2214EVM for a touch sensor of a robot.
From the terminal of the evaluation board,
I extend the sensor electrode pad with a cable and paste it inside the robot.
I confirm changes in capacitance when the electrode pad is touched by hand from outside
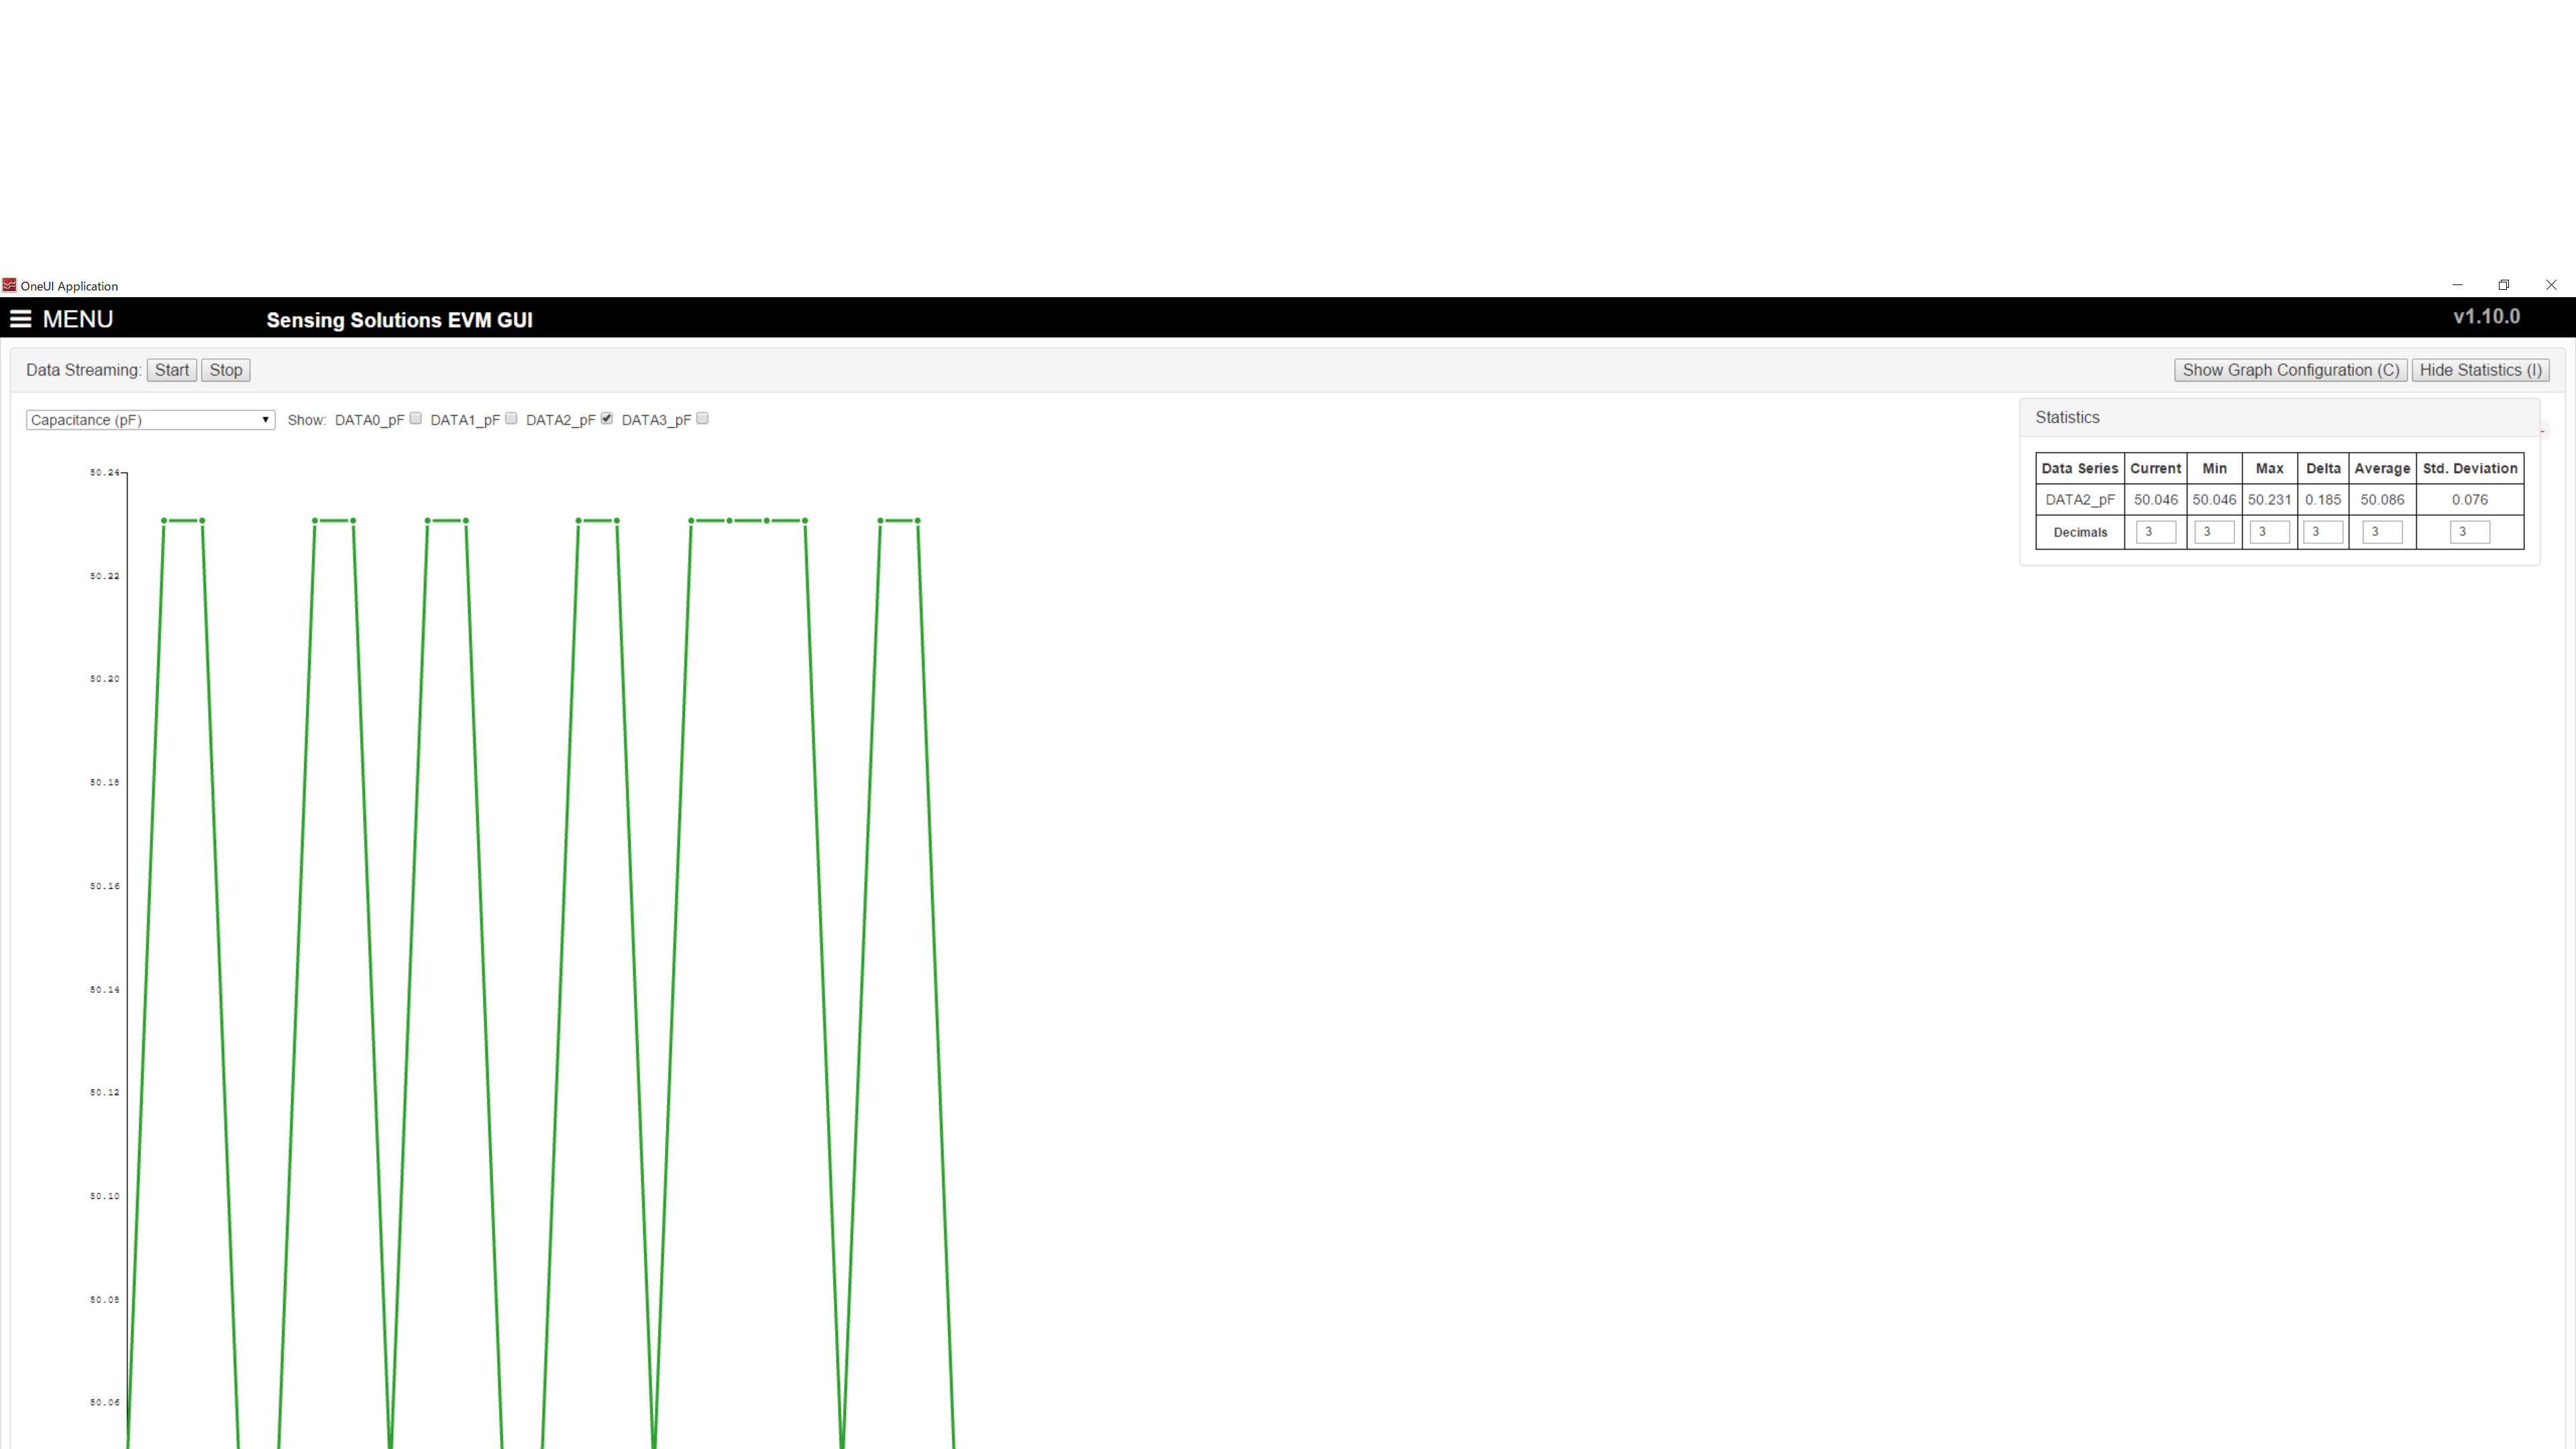
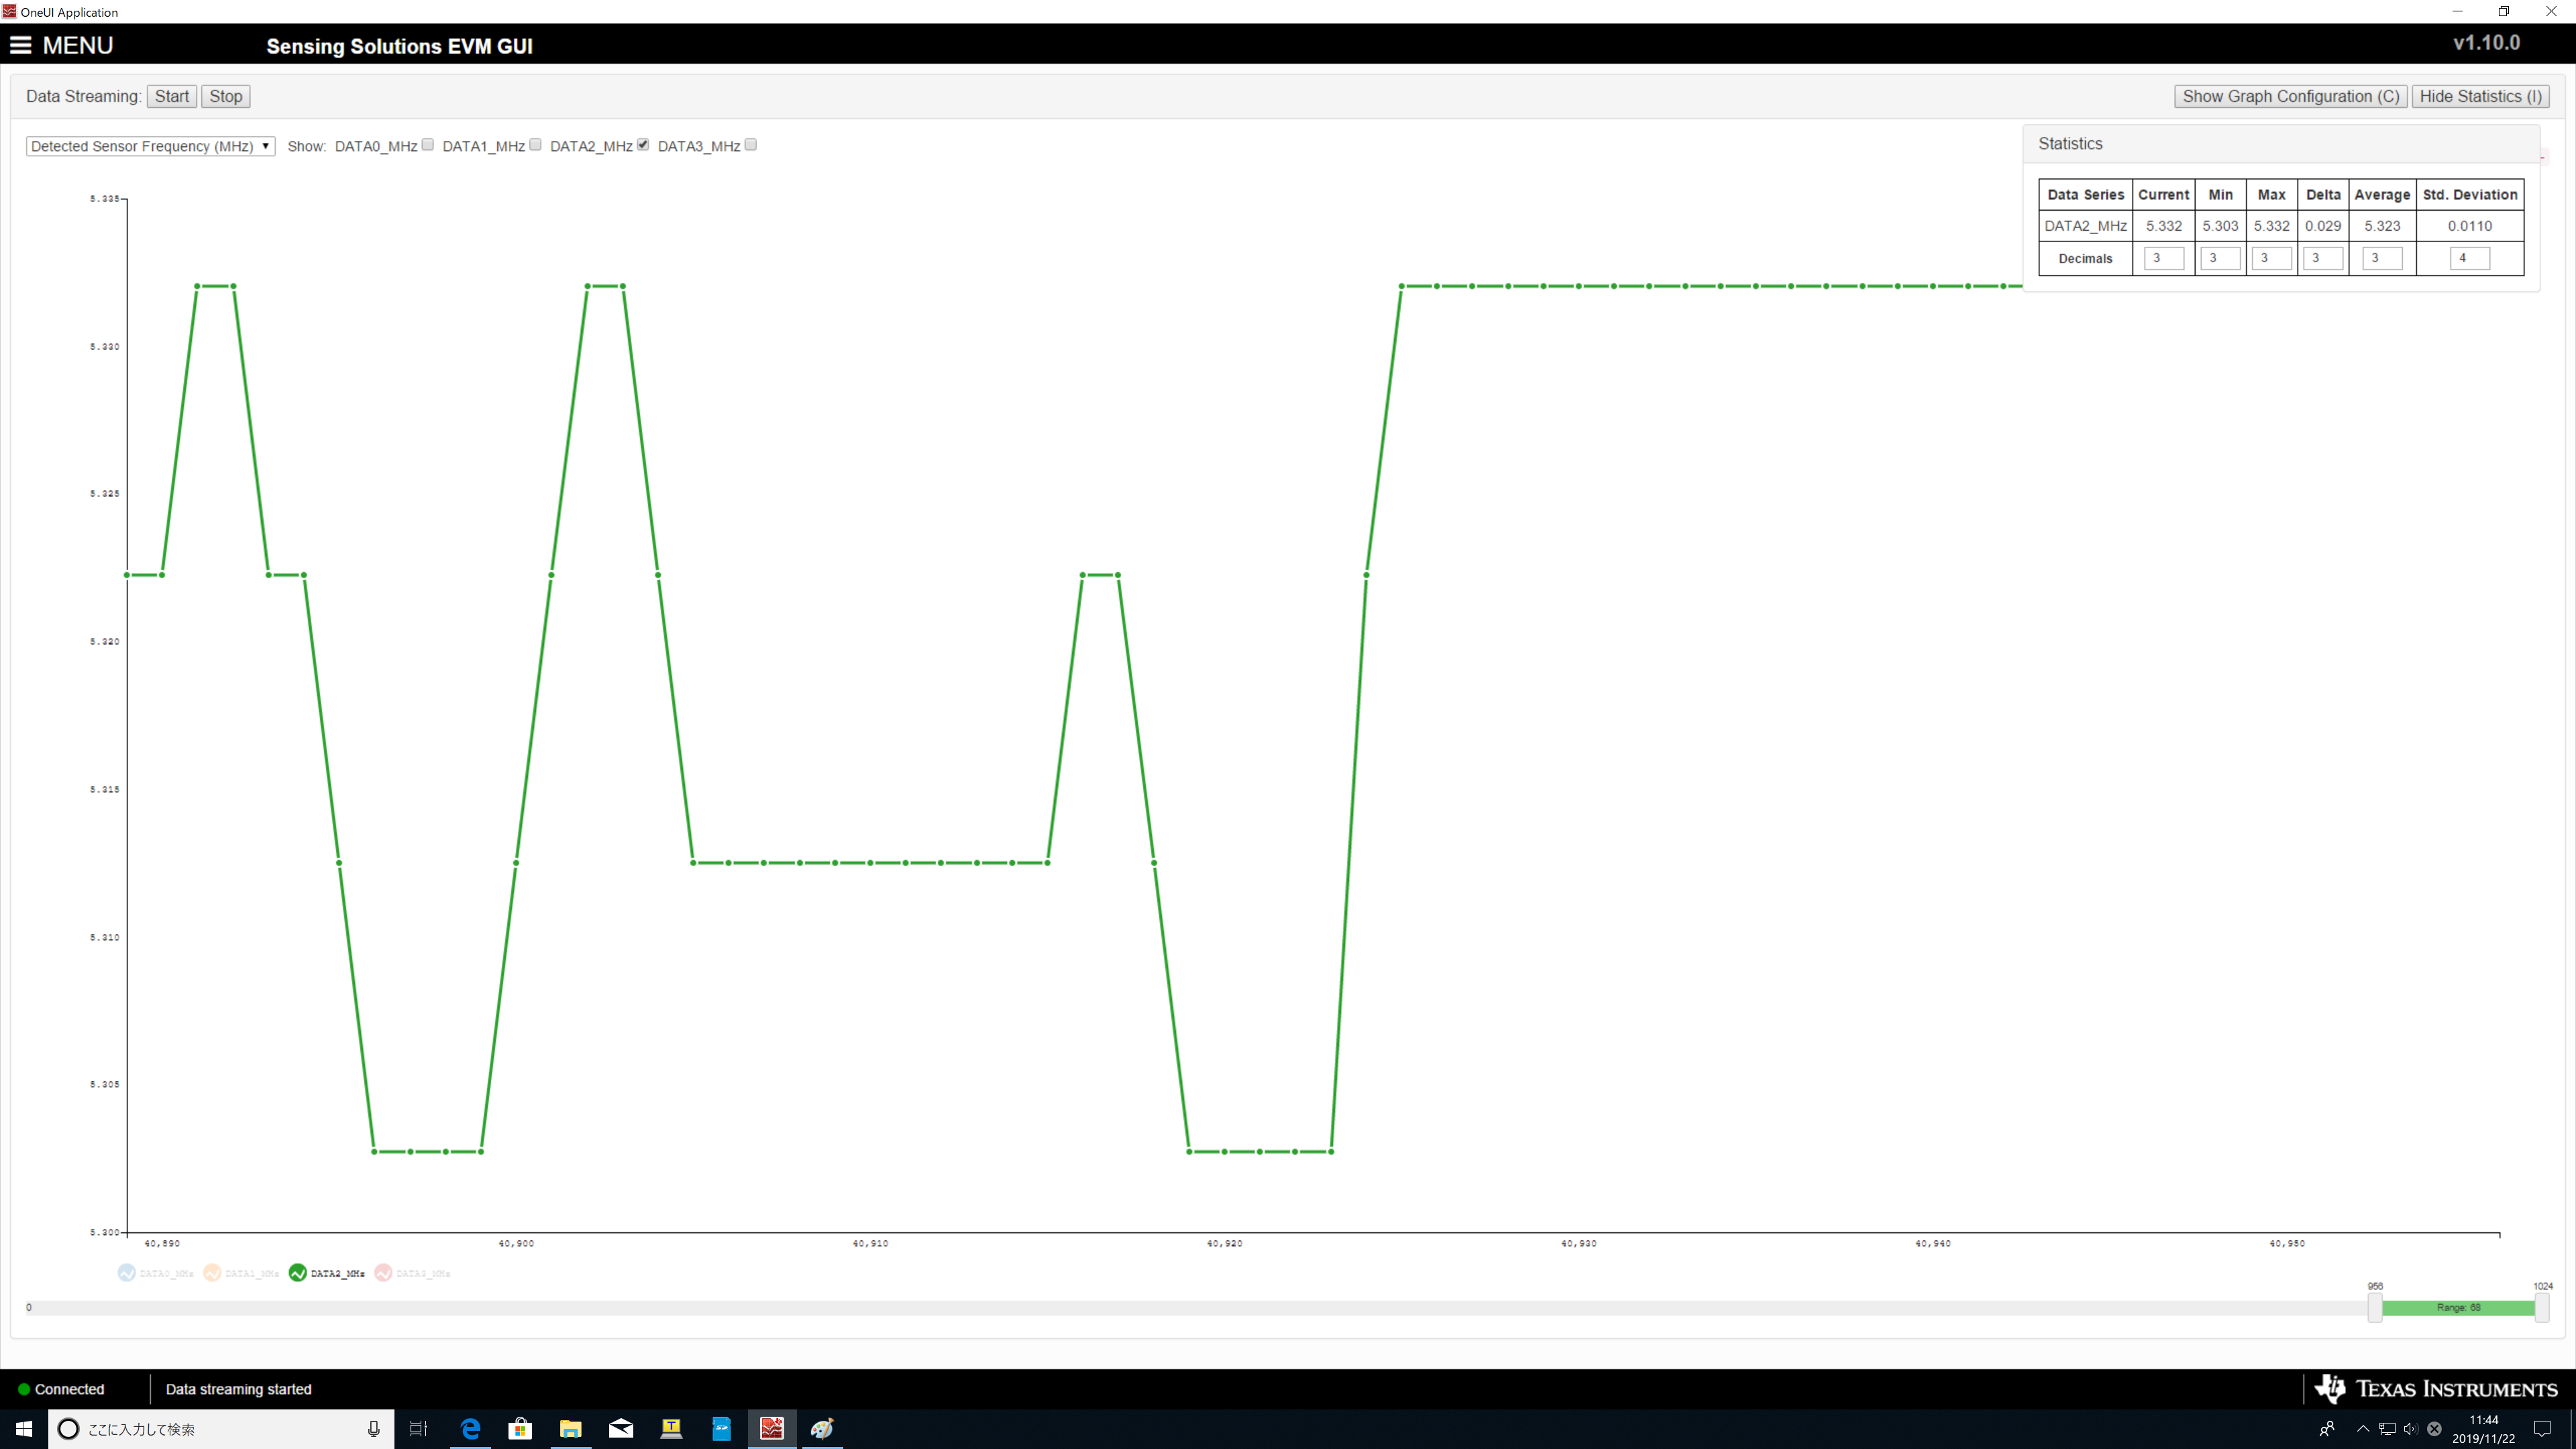
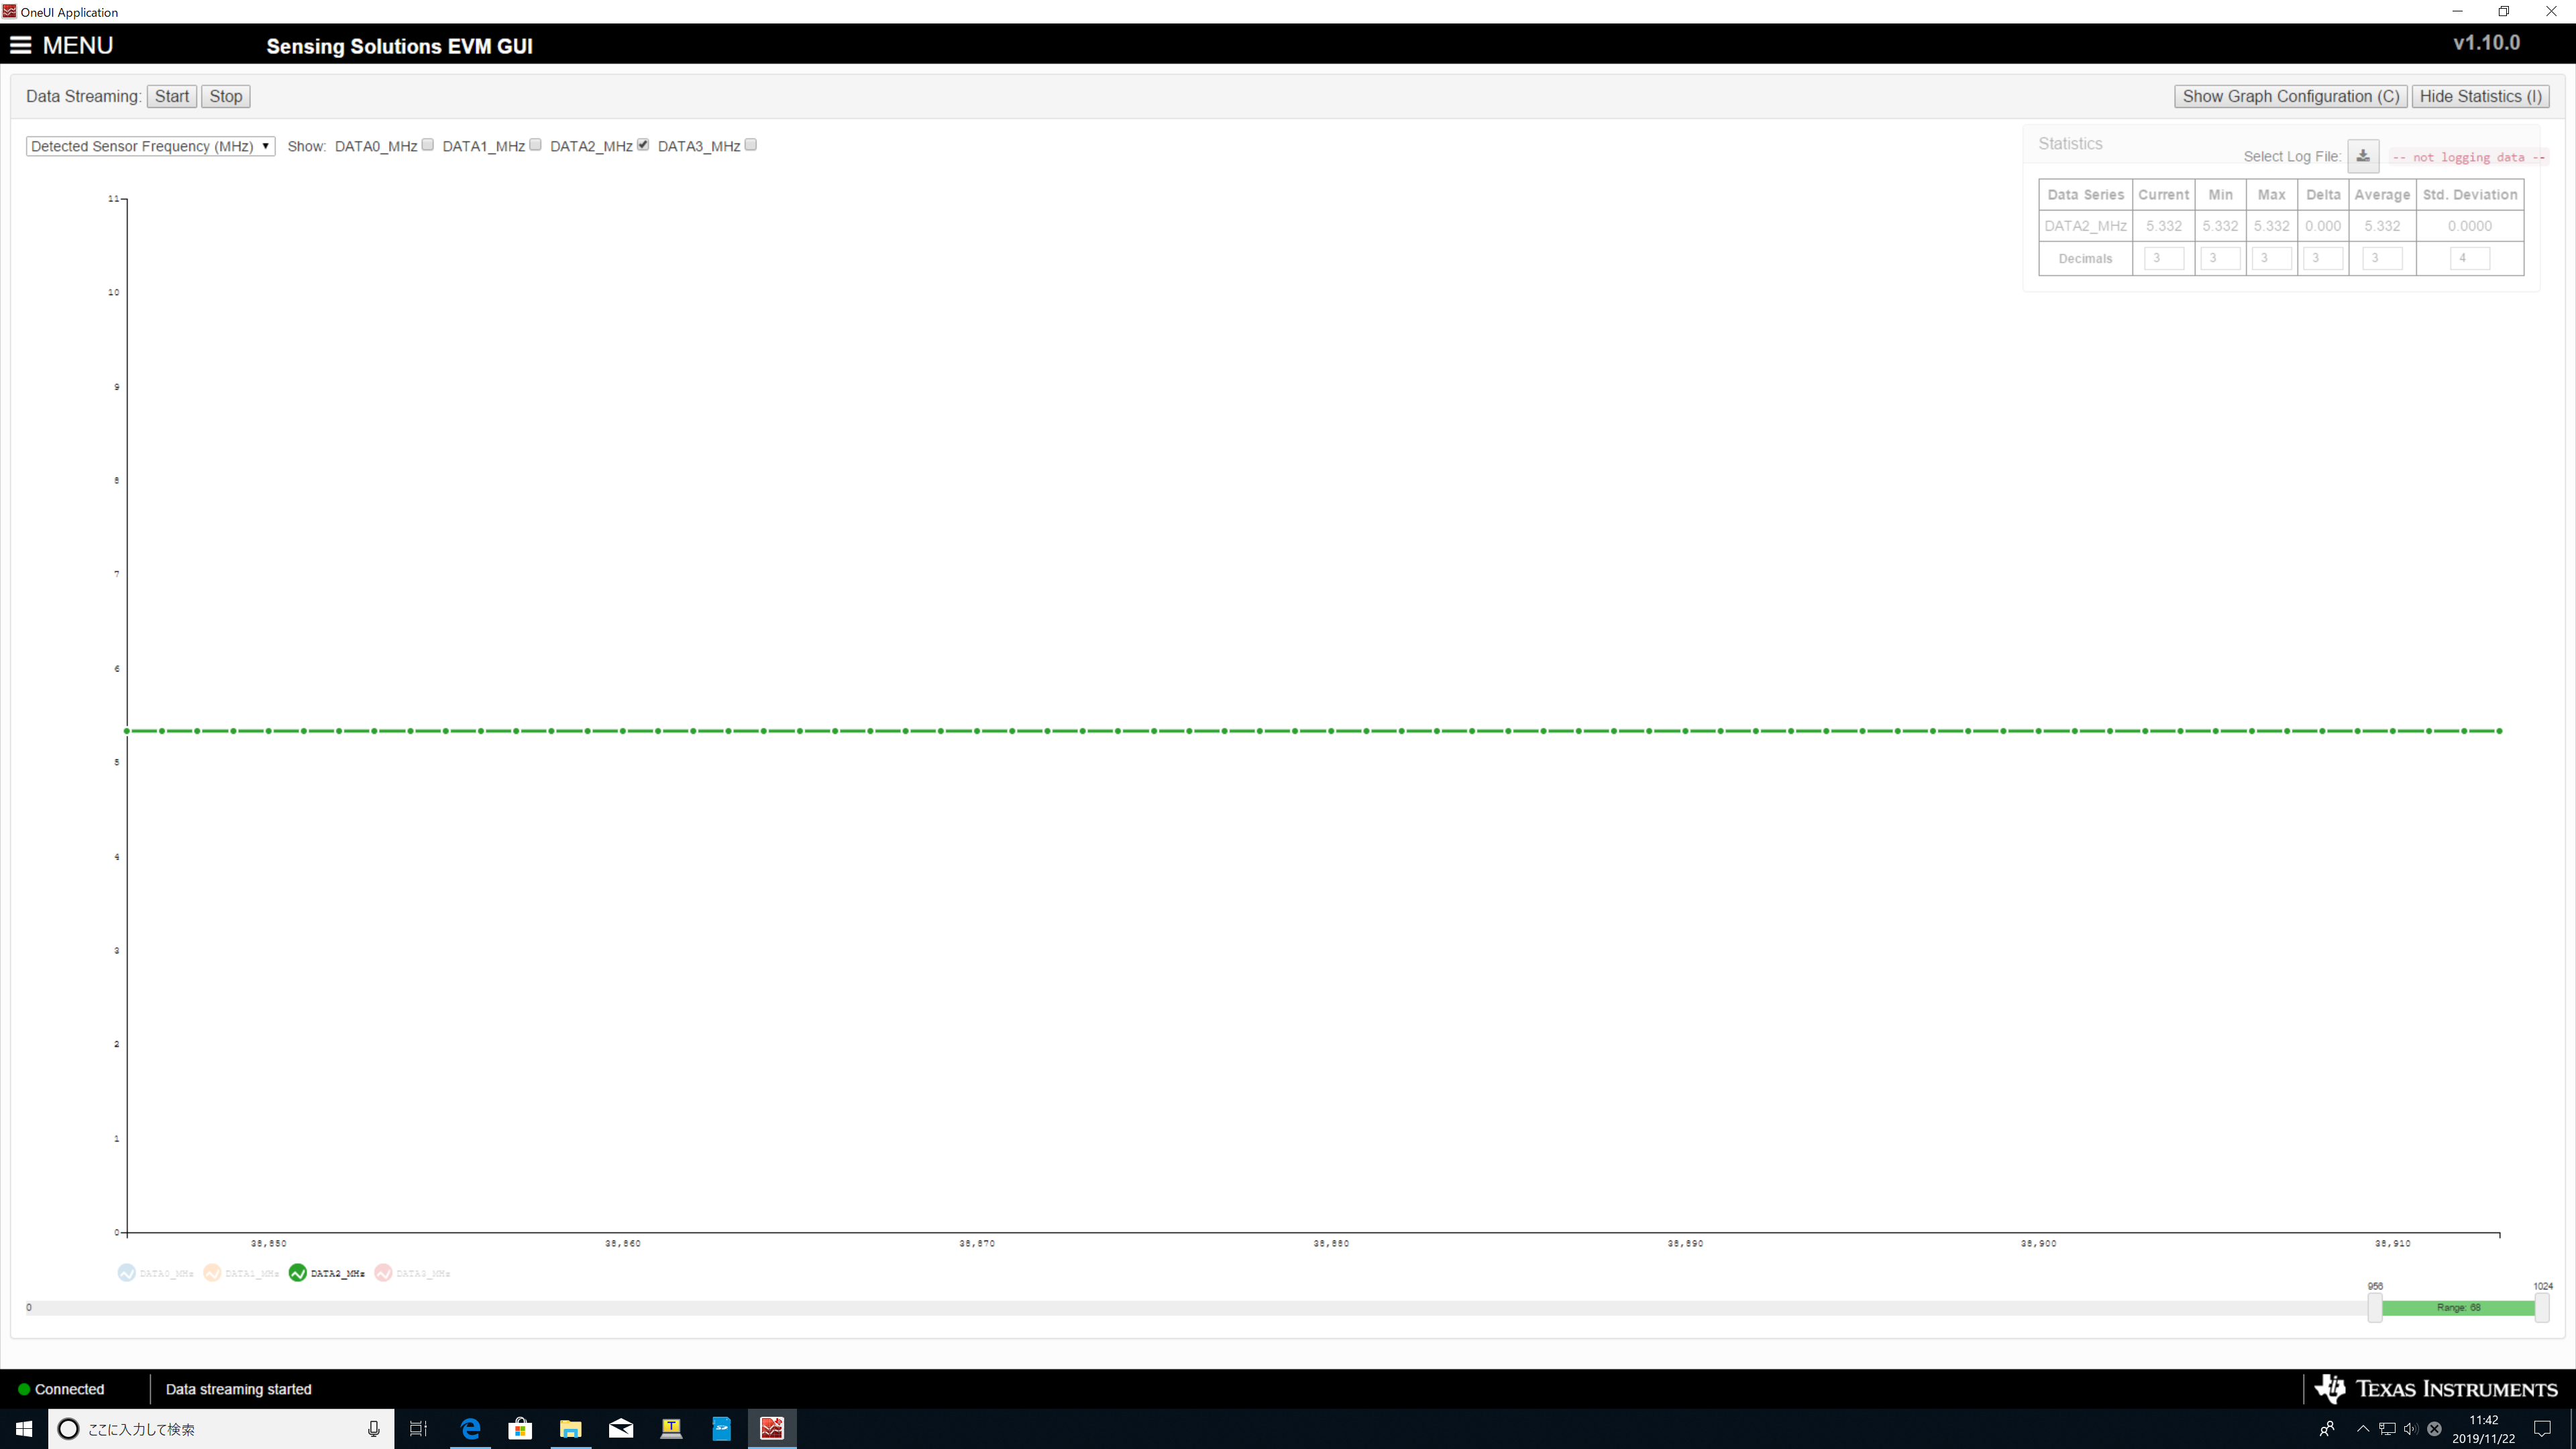
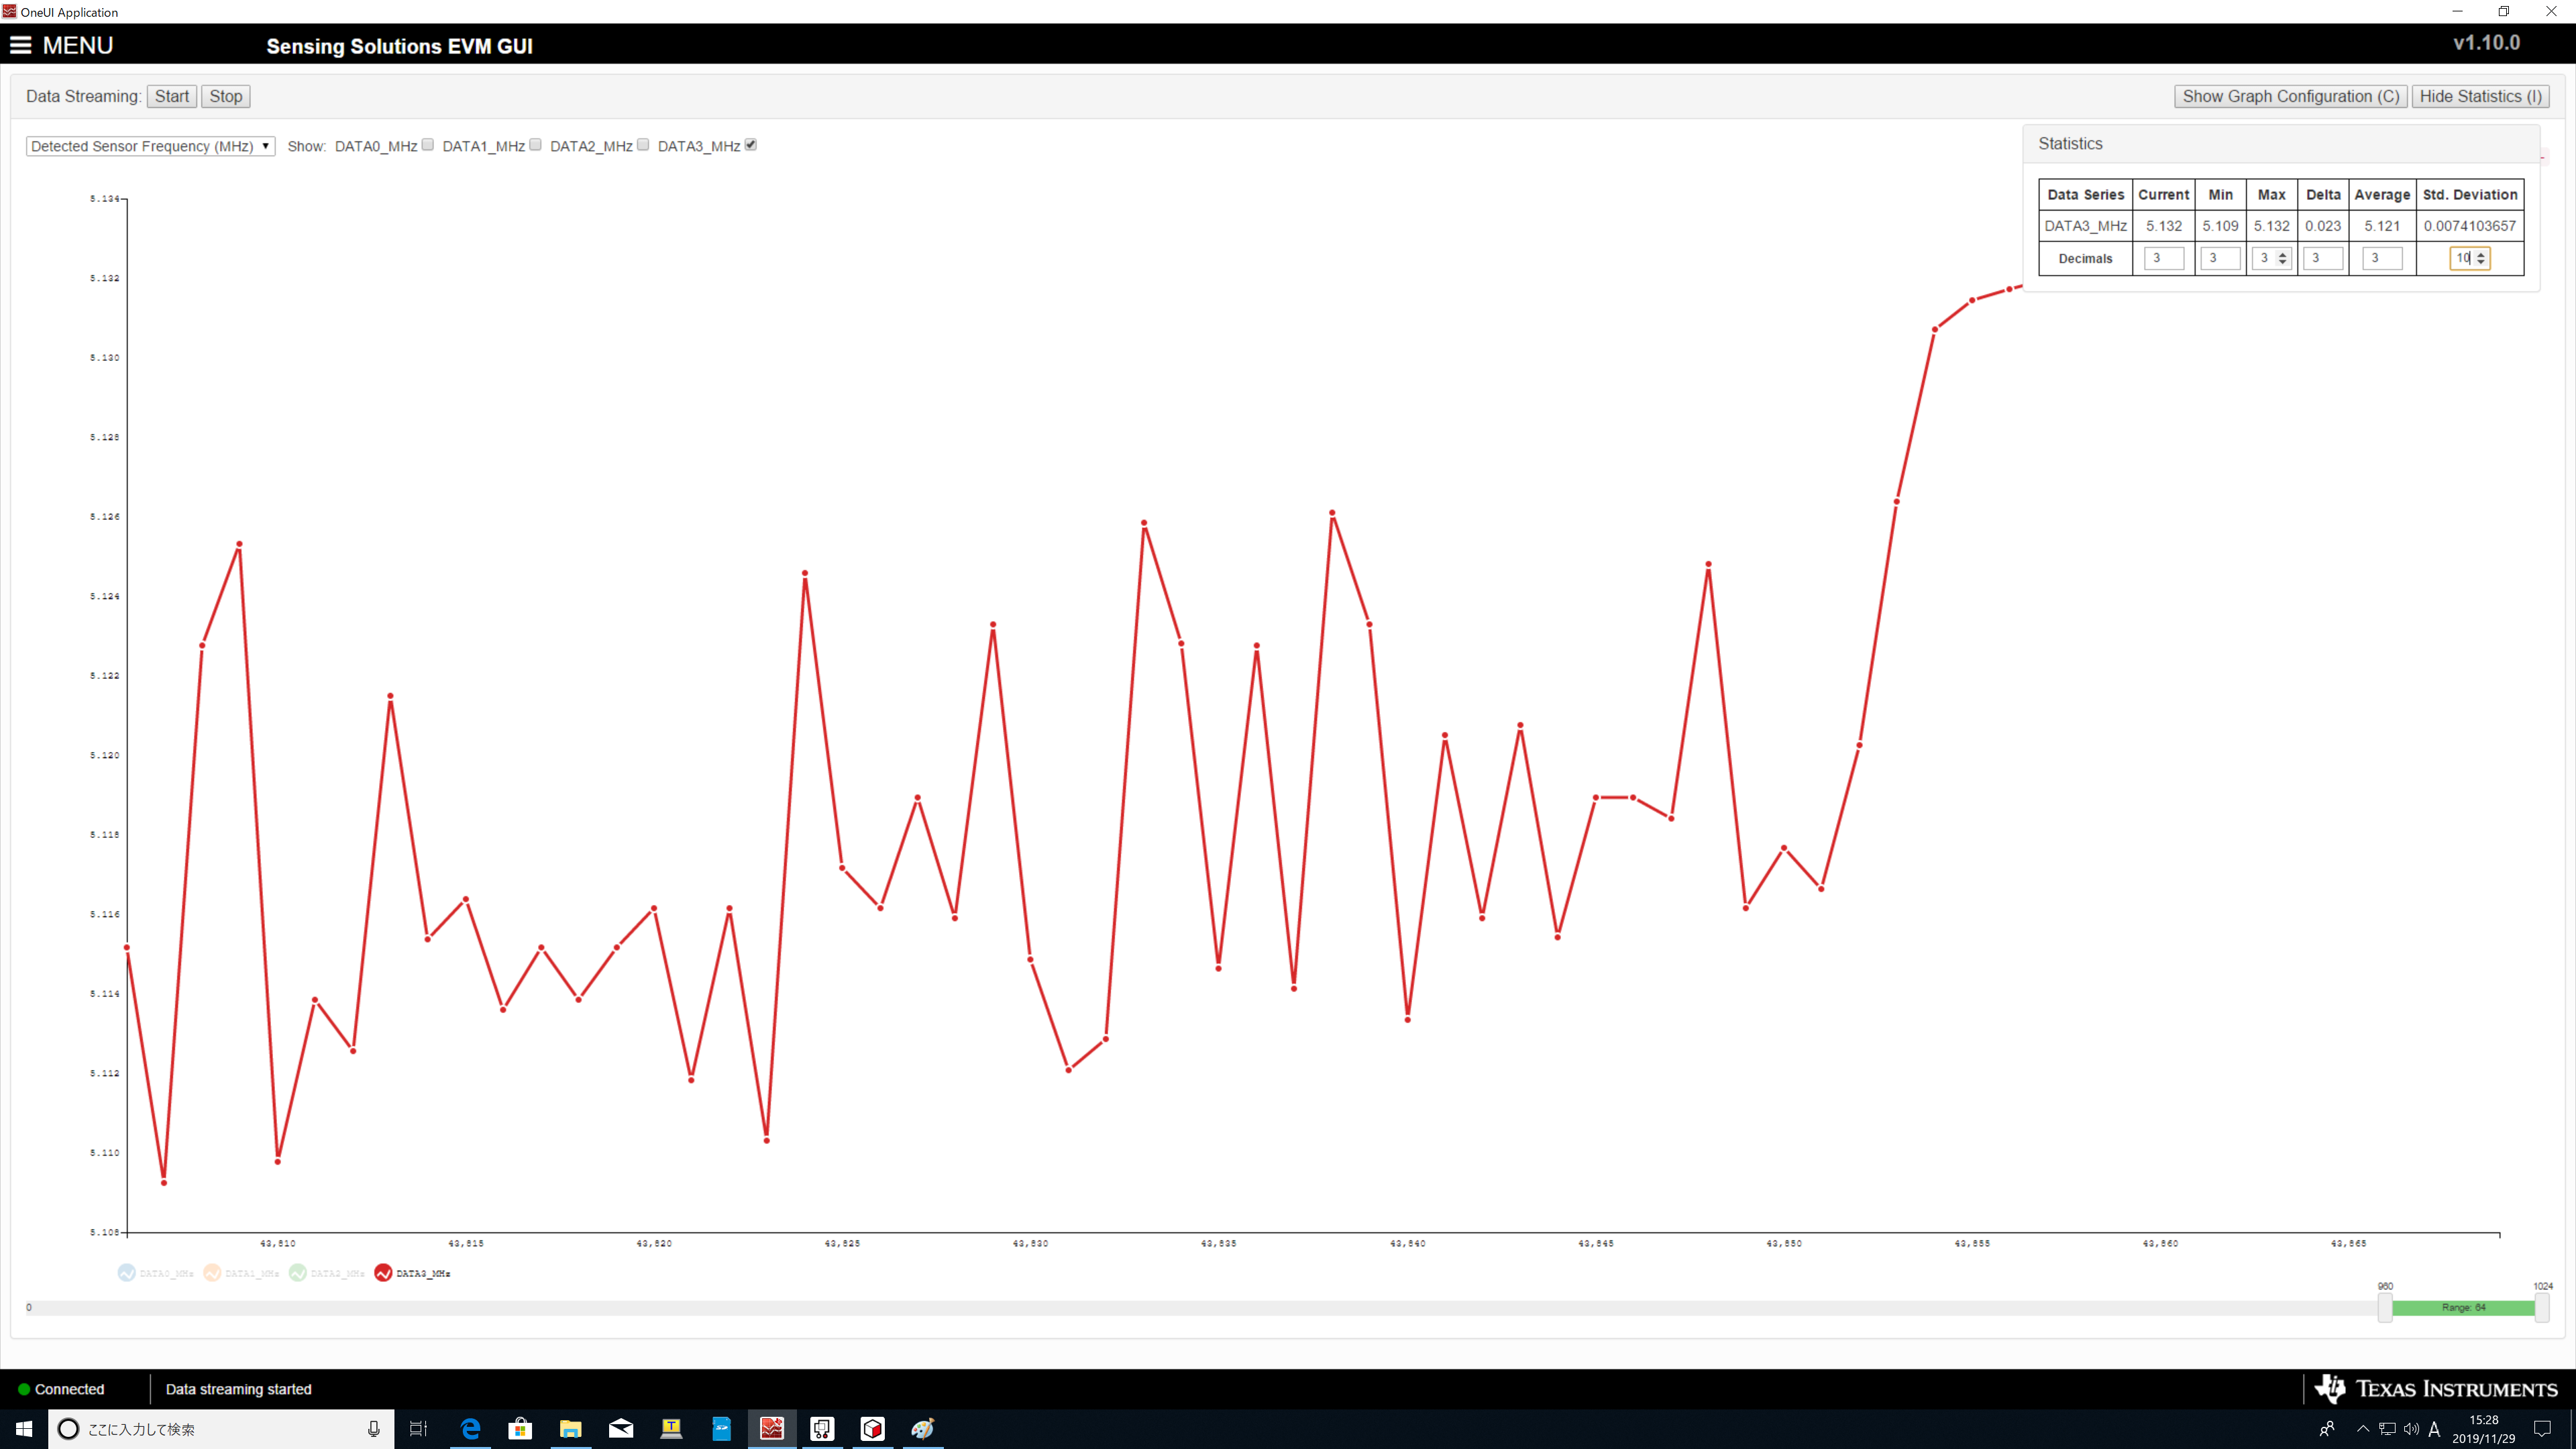
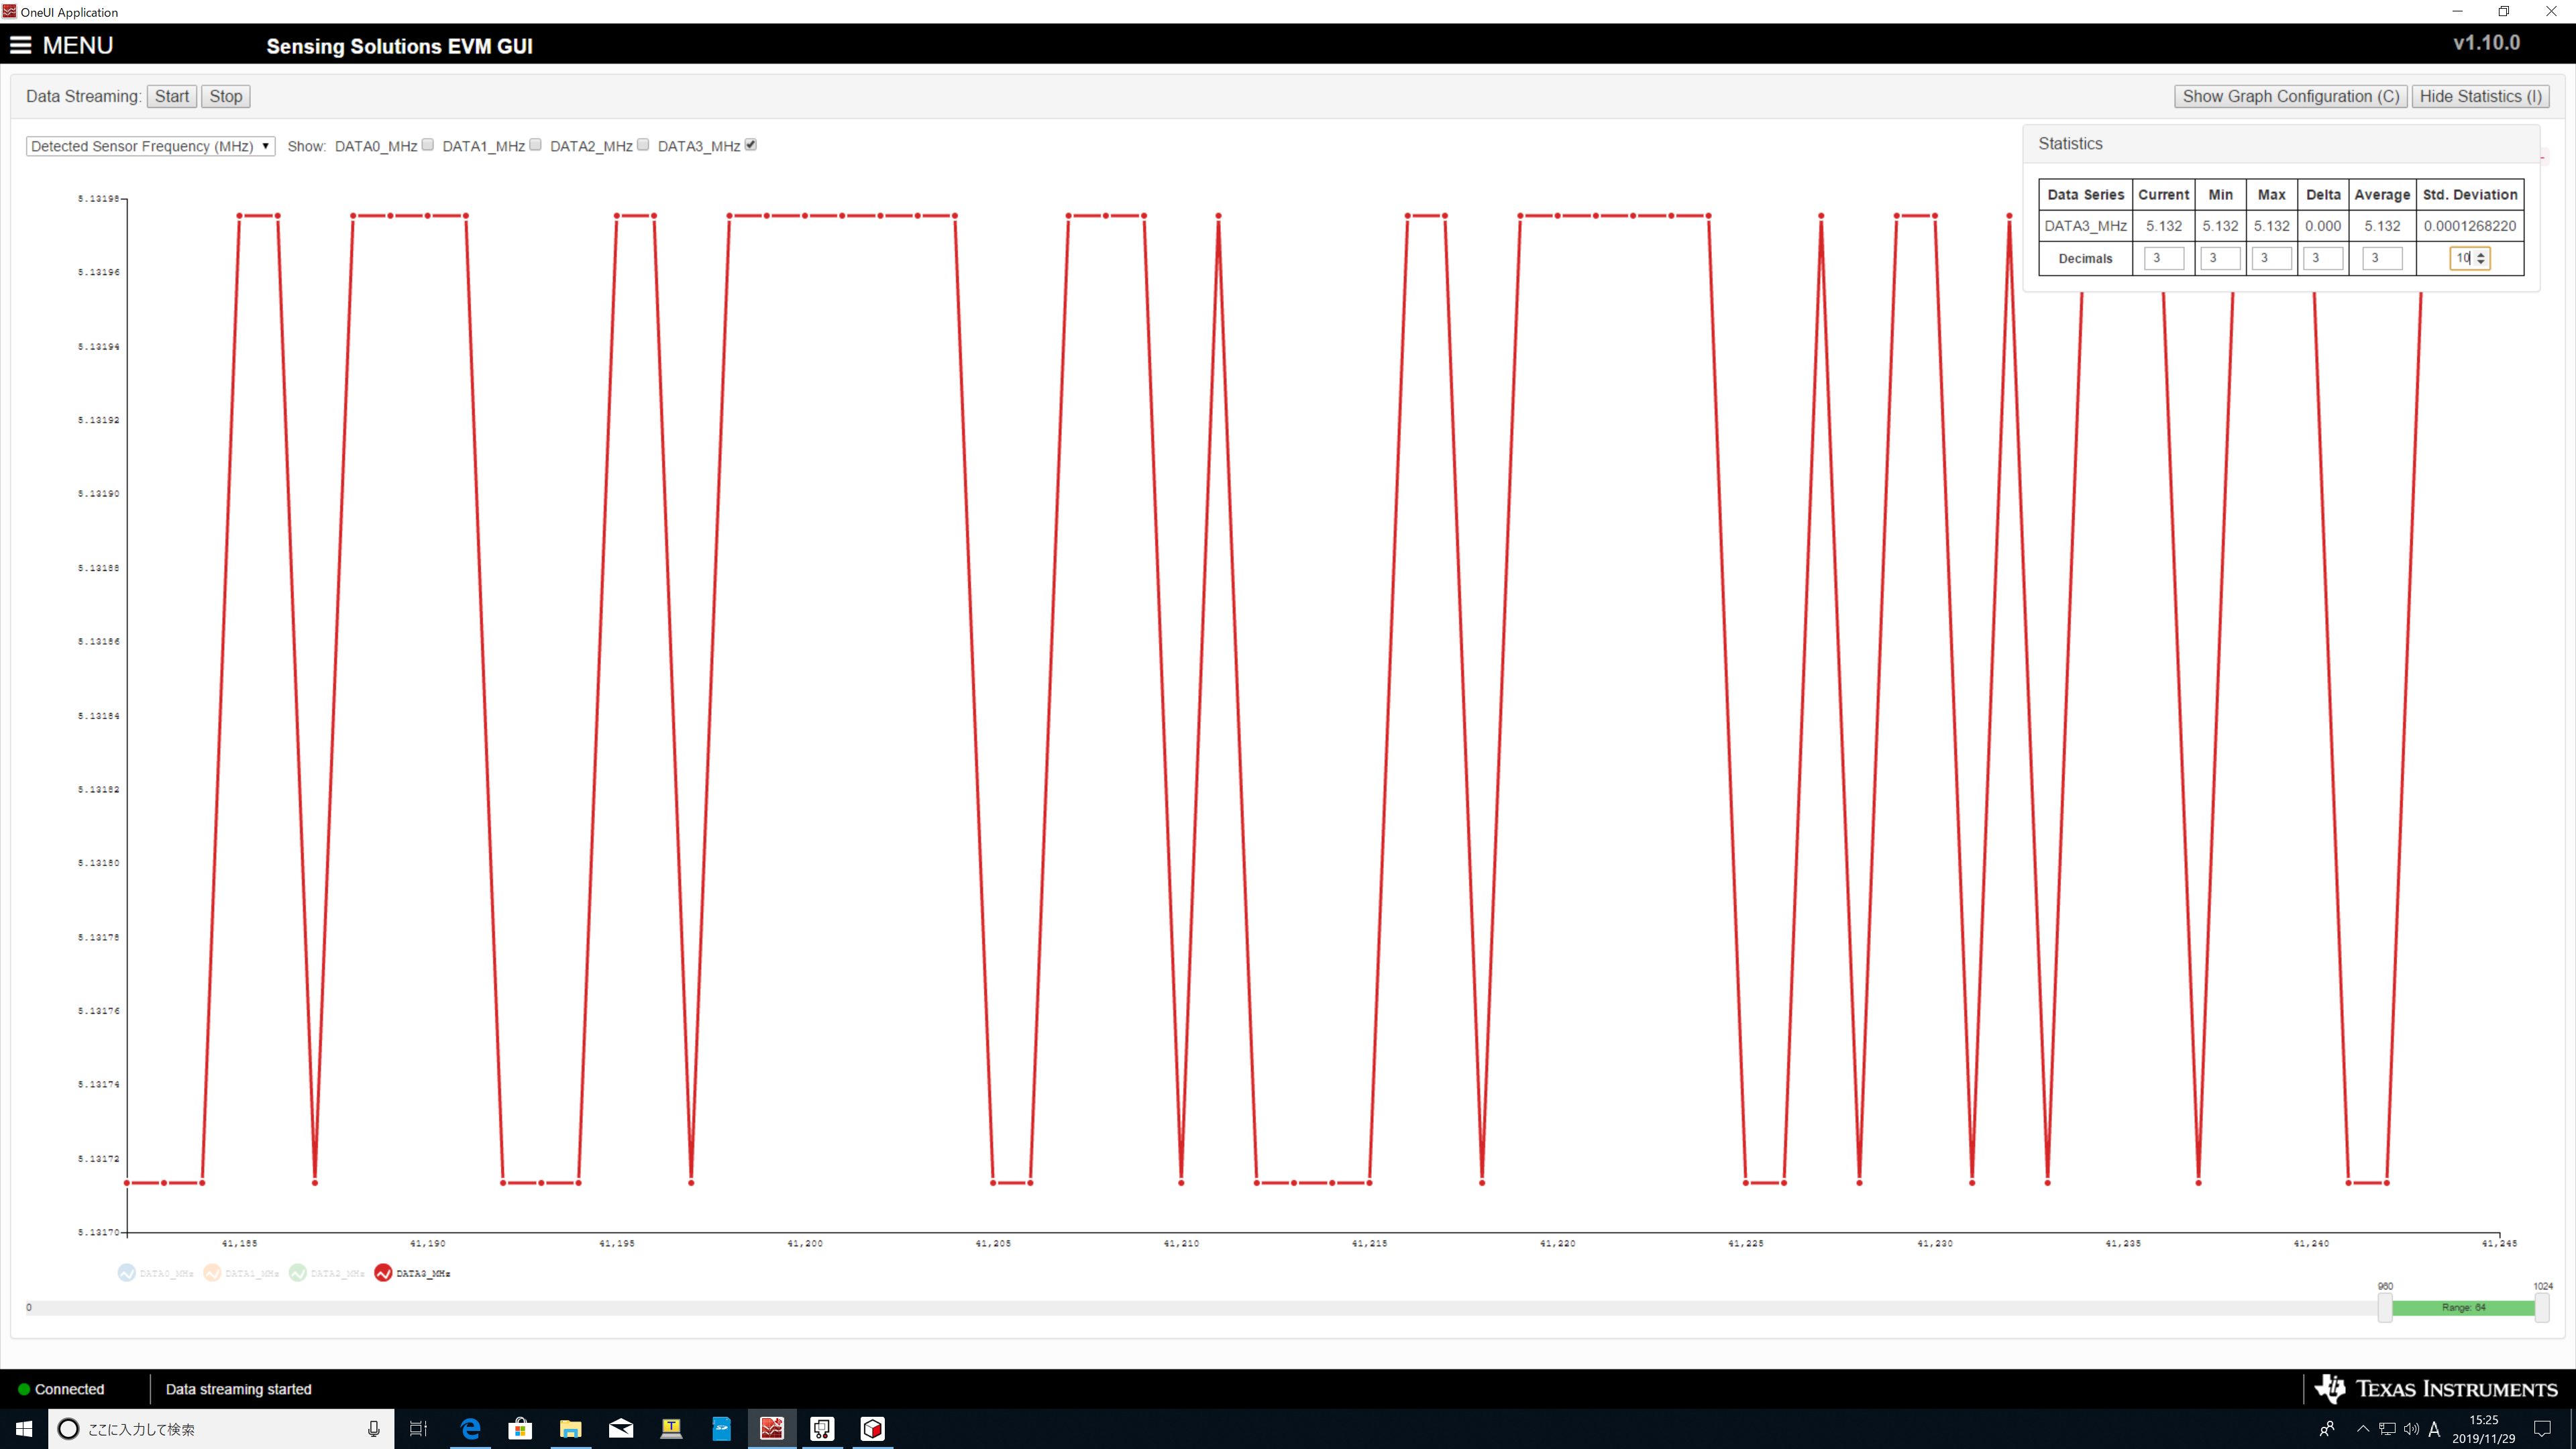
When measuring using [Data Streaming] of GUI
It shows 53pF when not touching the sensor, and 0.1 ~ 0.5pF capacitance increases when touching from outside.
My concern is that the sensor is reacting, but this 0.1 ~ 0.5pF is probably too small.
Can you tell me because I don't know if it's weak?
Regards
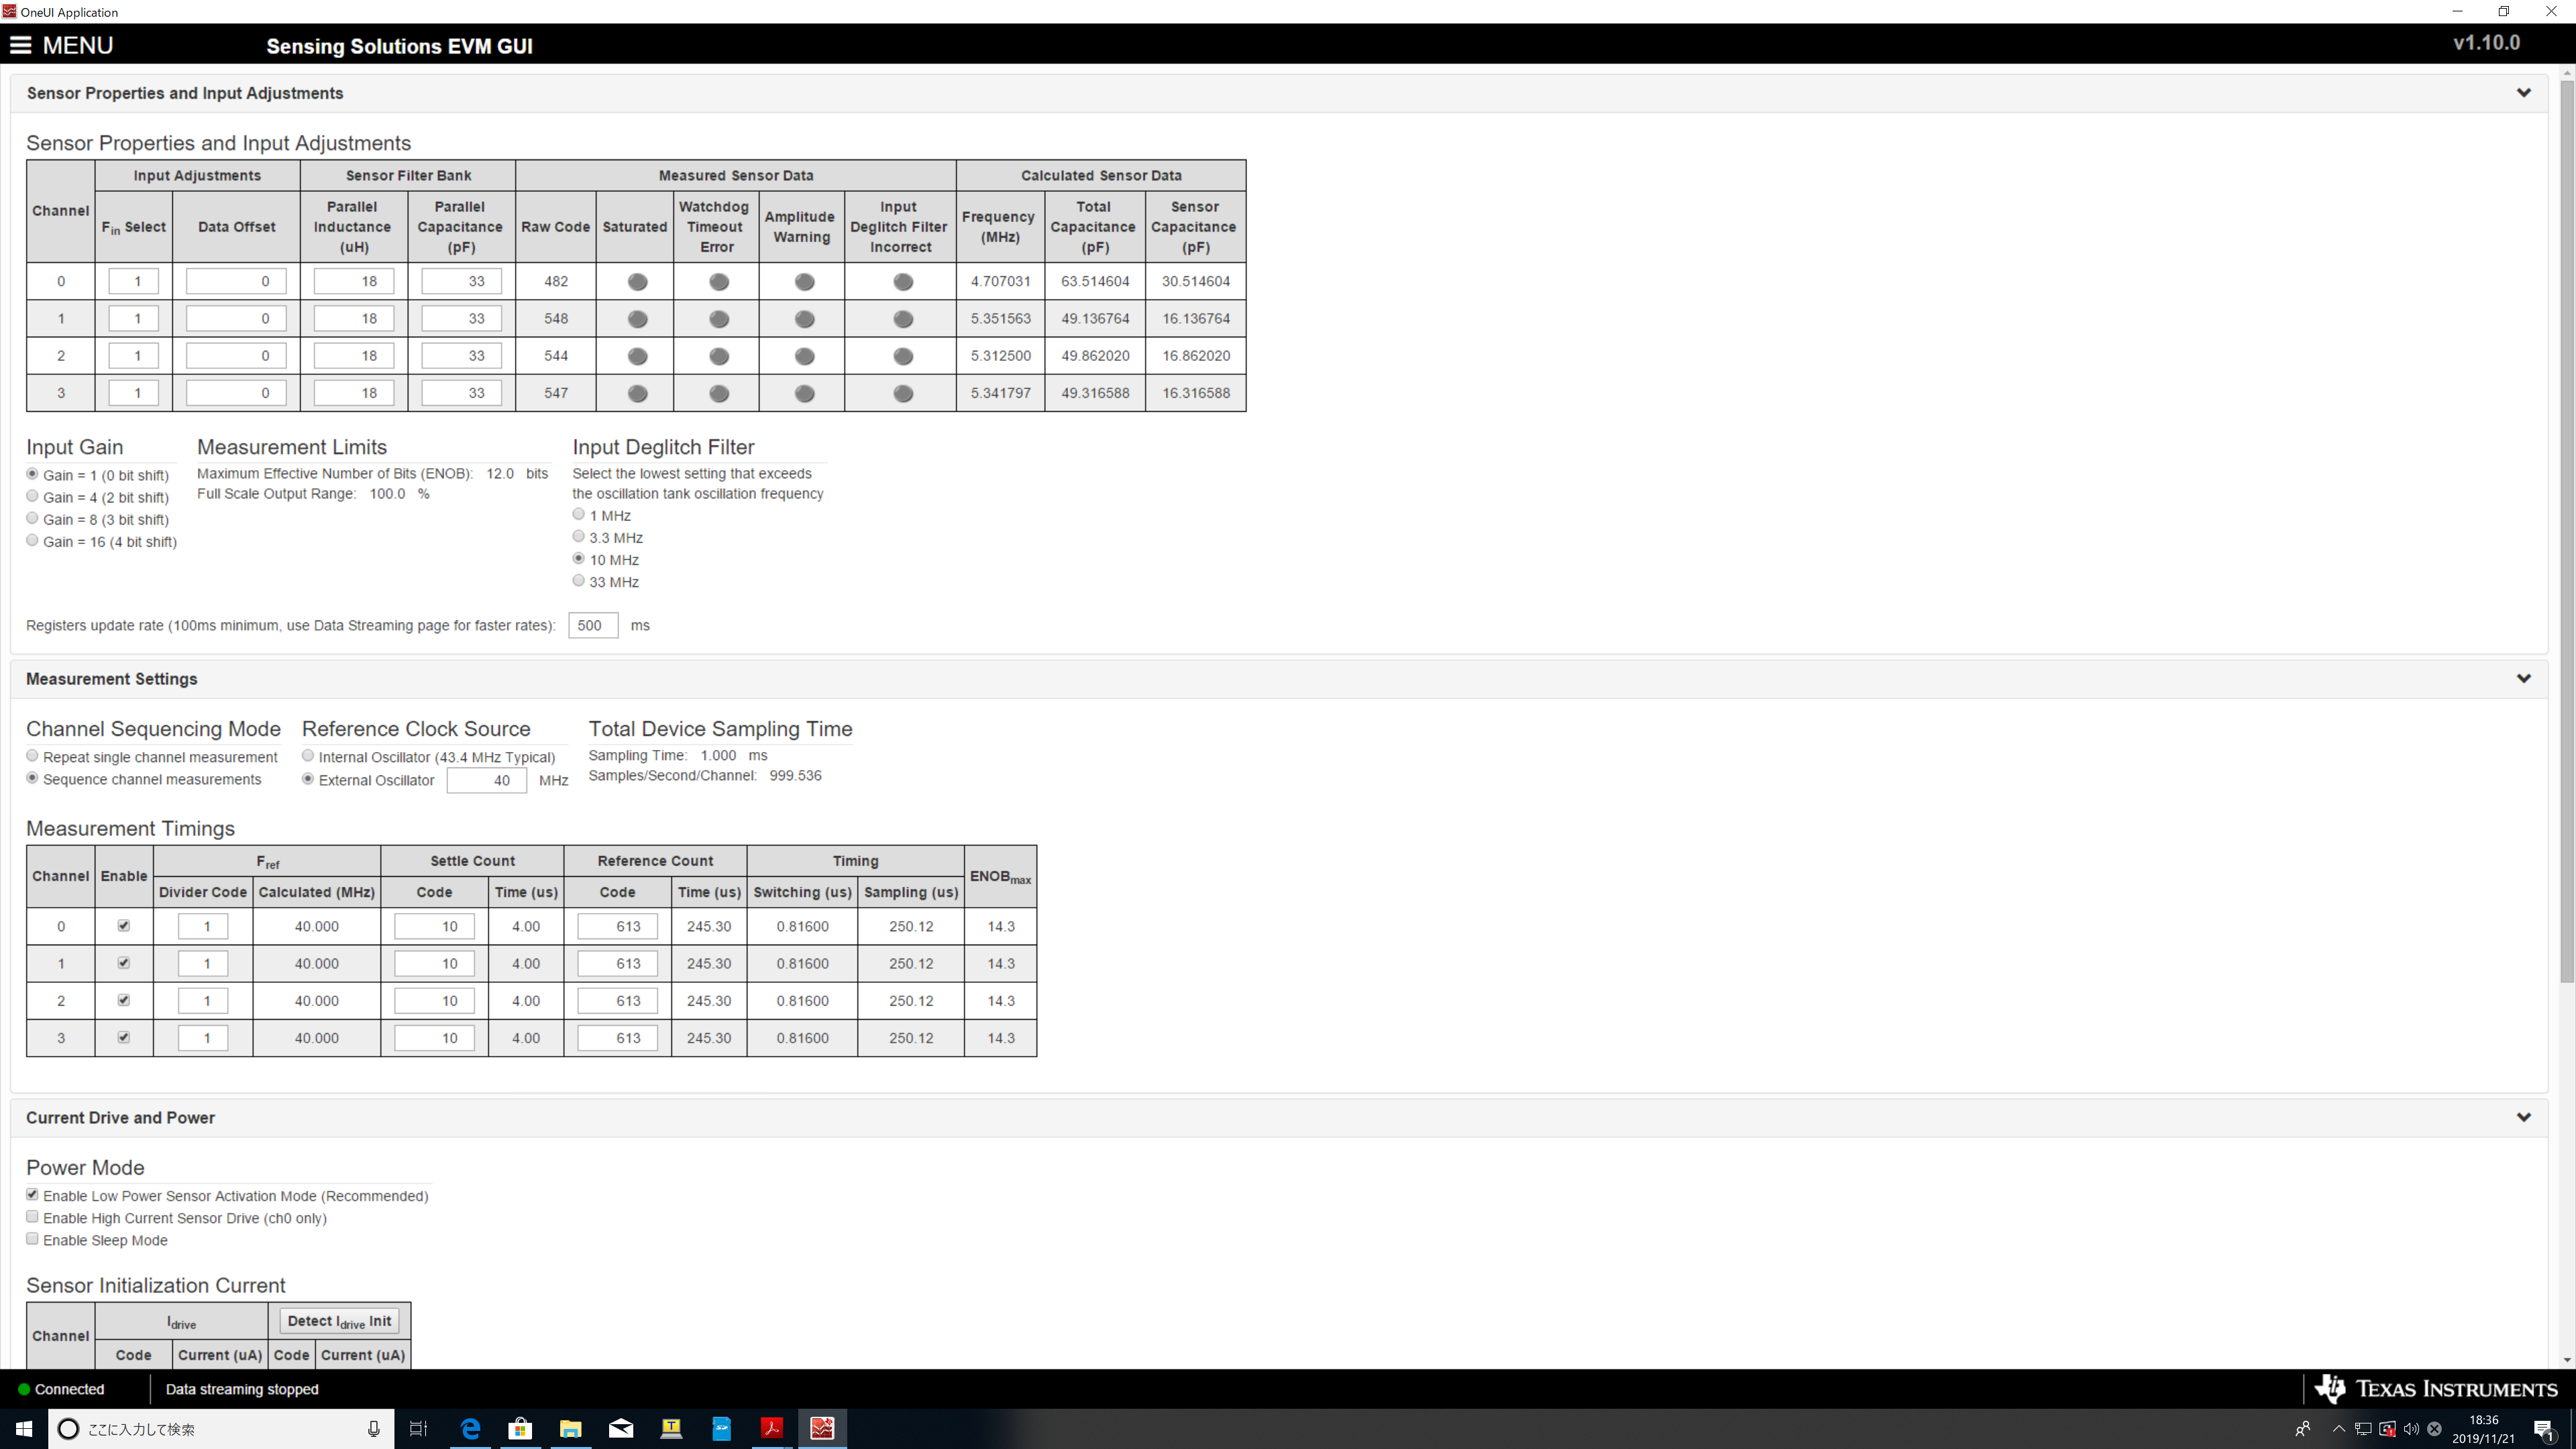
<Conditions>
Electrode size: 5mm x 10mm
Electrode thickness:0.2~0.3mm
Robot material: Plastic
Robot thickness: 0.2 ~ 0.3mm
Cable length: 10cm

<Configuration,DataStreaming>