Other Parts Discussed in Thread: IWR6843
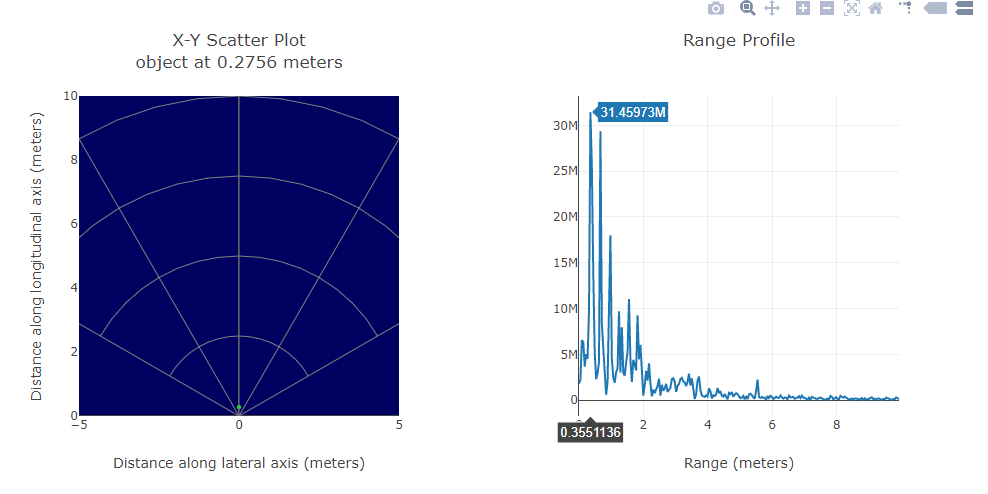
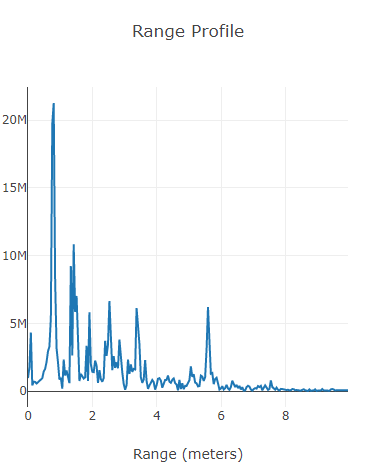
In my understanding, the high accuracy lab searches for the main peak, and therefore the strongest reflecting object and then zooms in on this peak to find a more precise result.
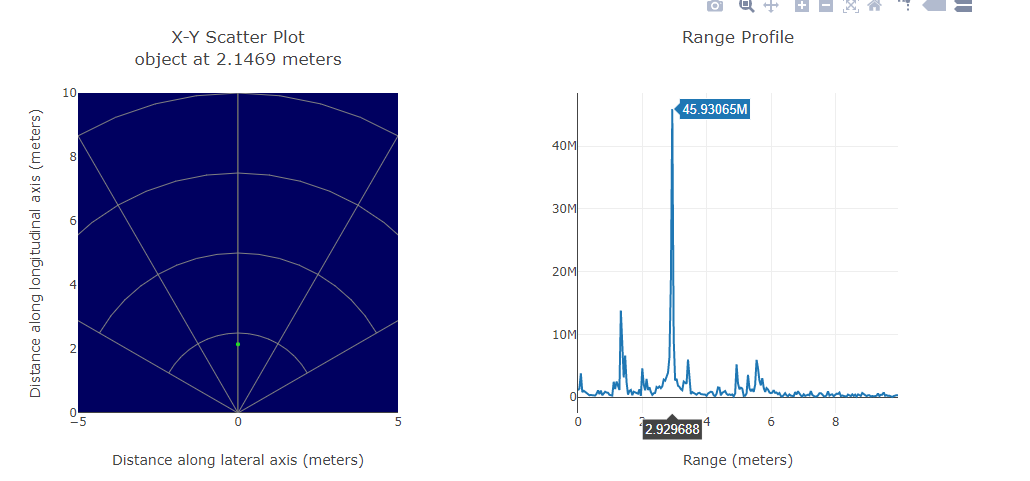
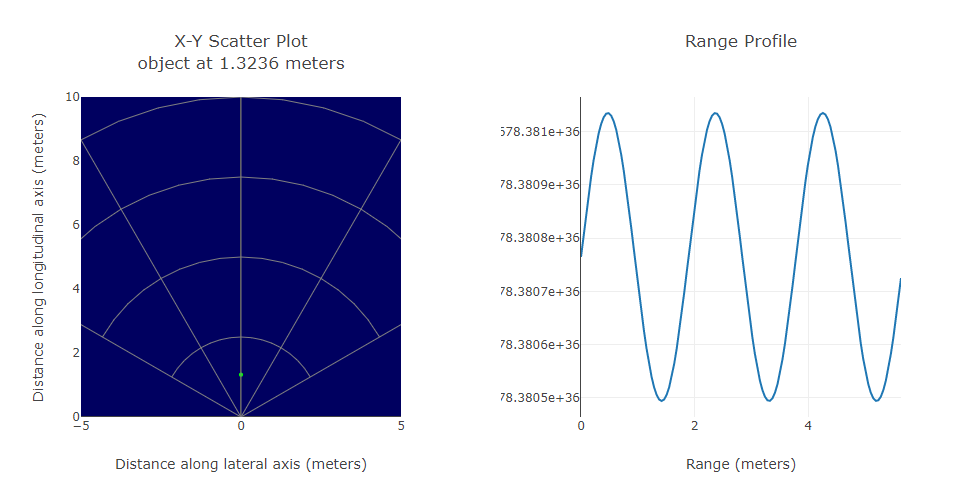
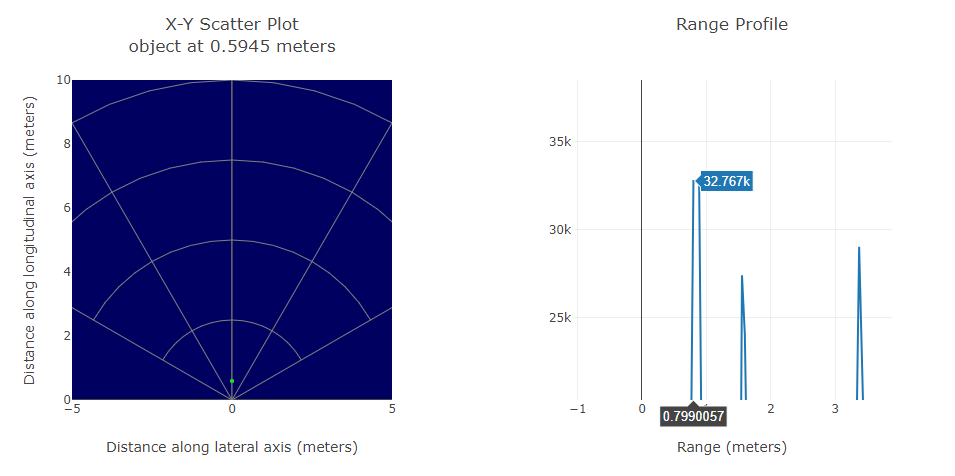
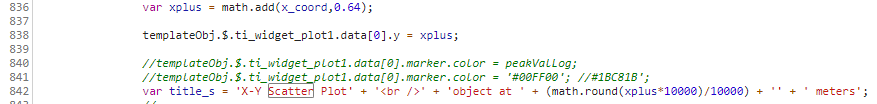
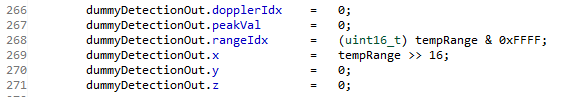
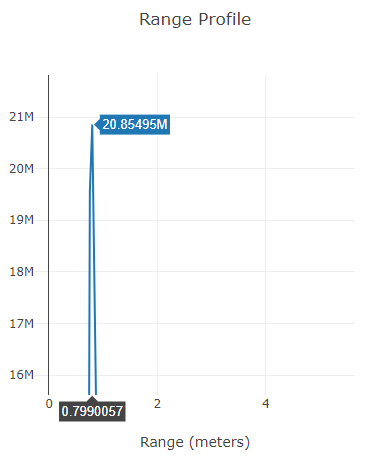
When I run the high accuracy visualizer though, the value from the X-Y plot and the main peak in the range profile differ around 20cm (see screenshots below).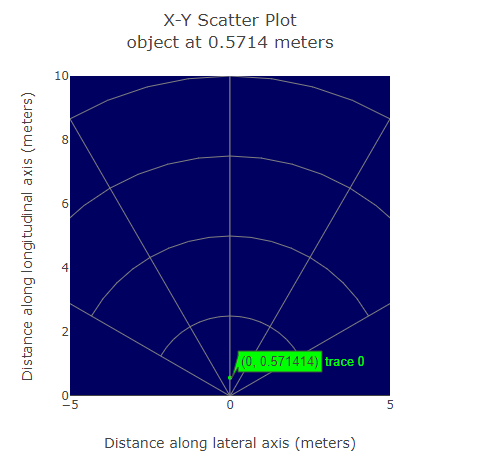
Is my understanding not correct? And if so, which of the values is the "right" one? Or otherwise where can I search for the error?
Thanks a lot in advance.