Other Parts Discussed in Thread: FDC2214
MAIN CONTENT
Dear TI Community:
Background
I am using the FDC2214EVM to monitor four capacitive sensors that are part of a control system.
Previously, I had used the Sensing Solutions GUI to gather data and verify sensor operation.
Presently, though, I would like to move to a single application that can both gather data from the FDC2214EVM and send control signals to other hardware in the system.
For this purpose, I have written a python script to communicate with the FDC2214EVM via the serial port (using the instructions provided here: https://e2e.ti.com/support/sensors/f/1023/t/295036#Q40).
Generating Timestamps
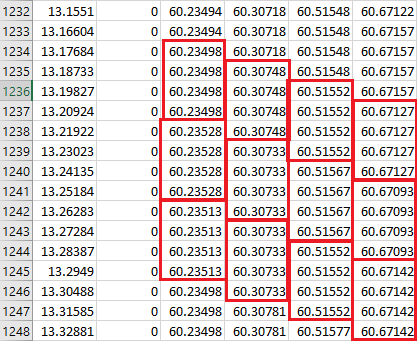
The sampling time for four channels is known (42.498ms), and I have verified that the capacitance readings change approximately every 42.498ms (every 4 rows in my log.csv -- see below).
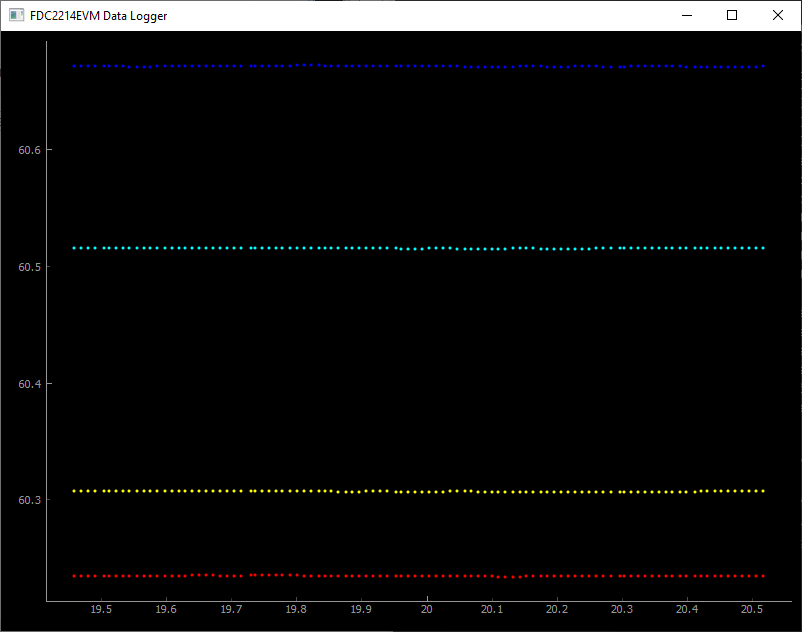
However, the timestamps I am creating (using time.time(), in python) are not increasing exactly by 42.498/4=10.6245ms increments. This is easily apparent when viewing the graph (see below).
This means that my timestamps are inaccurate.
Questions
1. What is the best approach for generating maximally accurate (equivalent to the accuracy afforded by the Sensing Solutions GUI) timestamps for this data?
2. How does the Sensing Solutions GUI generate its timestamps?
3. When/if my python script falls behind the input buffer (more than 32 bytes accumulate in the buffer), the timestamps will become even less accurate. Do you have any advice for dealing with this scenario?
Thank you!
Dylan
ADDITIONAL INFORMATION:
The setup code works as follows:
1. Open serial port.
2. Send 'stop streaming' command in case the FDC2214 is already streaming data.
3. Send 'write register' commands, as appropriate, to configure the FDC2214.
4. Open csv file for writing.
5. Send 'start streaming' command.
6. Reset the input buffer for the serial port.
7. Record start time.
8. Enter infinite loop for reading.
The infinite loop code works as follows:
1. Read 32 bytes from the serial port.
2. Record the elapsed time in seconds with respect to the start time.
3. Extract capacitance values for all 4 input channels.
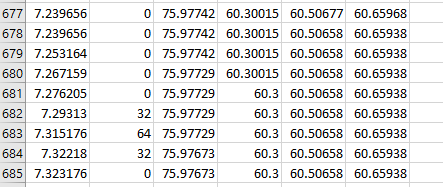
4. Log data in csv, including: [timestamp, bytesInWaiting on serial port, c0, c1, c2, c3]
The output looks like this:
The plot looks something like this: