This thread has been locked.

If you have a related question, please click the "Ask a related question" button in the top right corner. The newly created question will be automatically linked to this question.

IWR6843AOPEVM: the rangeProfile_cplx matrix of data extracted by Matlab

Part Number: IWR6843AOPEVM

When I run the lab of vital sign, I extract the data using matlab and I found that rangeProfle_cplx matrix has many columns.

I use the default parameters and the frame rate is 20Fps.

and if I save data for 70 seconds, I think the rangeProfile_cplx matrix should be 70*20 columns.

But in fact it has 50040 columns. I don't know why.

I'm confused, I want to figure out the columns of the rangeProfle_cplx matrix. 

Second question, If I changed the value of max range from 0.9m to 5m,

I found that it still can work but I can't extract the data out because Matlab alway get an error that the parameters of Reshape is not integer which means that the numChirpsfile parameter should be an integer.

However it is a decimal. Is it because I changed the parameter? Or what else resons?

Looking forward to your reply.

  • Hello,

    Please allow us a couple of days to look into this and get back to you by Wednesday.

    Regards

    -Nitin

  • Hello,

    Do you have any idea now?

    Regards,

    QI

  • Hi QI,

    The Vital signs lab provides the parser utility to read and plot the saved data file, under C:\ti\mmwave_industrial_toolbox_4_1_0\labs\vital_signs\68xx_vital_signs\parse\parse_vitalSigns_demo_dat_file.exe.

    I am not sure if you are using that or your own parsing script but the parsing function works fine with the provided utility. The above directory includes the source file as well for the parser utility, so you can refer to that.  

    When you run the above executable, it will prompt you to select first the .cfg file and then the saved data file (dataOutputFromEVM.bin). Make sure to select the correct .cfg file which was used when saving the data.

    Thanks

    -Nitin 

  • Hi Nitin:

    Thank you for your reply.

    Yes, I use the parsing script you told me. There is the same problem.

    I think the total Frames not equal to the record time* frame rate.

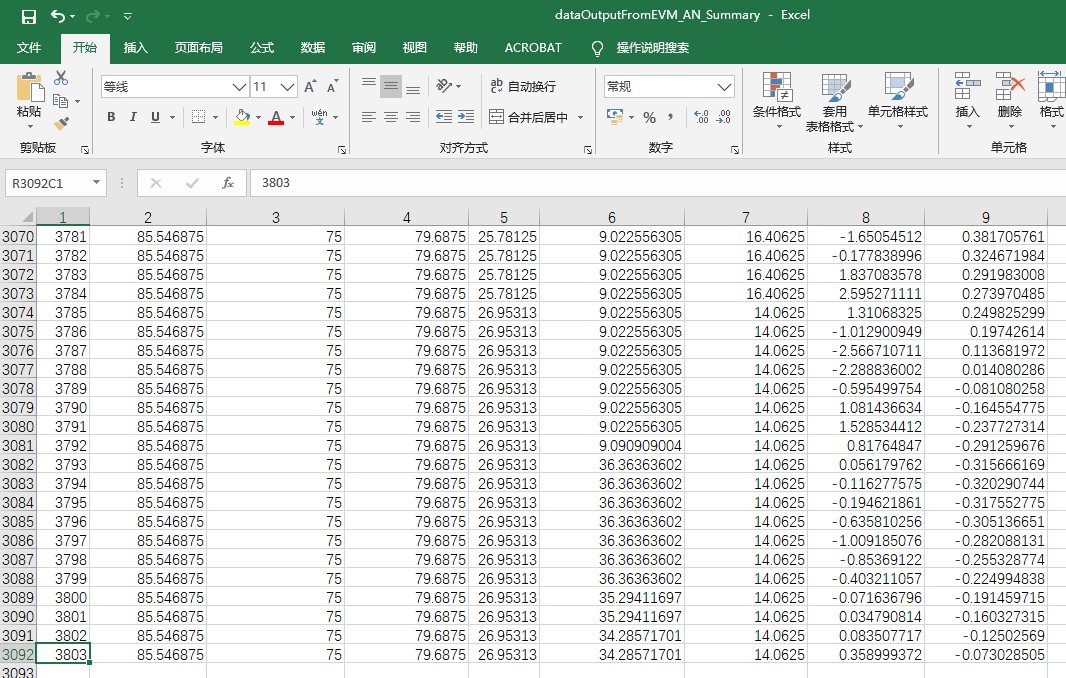
    The example TI provided in vital signs parse the data and the total frame is 3803, does that means the record time is be 3803/20=190seconds?   

    I'm confused about the total frames not equals to record time*frame rate.

    Can you explain this?

    Best regards,

    Qi

  • Hi Qi,

    Thanks for your patience. I was able to reproduce the behavior you mentioned above and found the reason for it looking at the GUI source. The reason for these extra frames in dataOutputFromEVM.bin is that the GUI opens this file in append mode which causes the new data to be added to any existing data in the file from a previous run.

    To avoid this, please delete the data file from the gui_exe directory before running a new capture:

    labs\vital_signs\68xx_vital_signs\gui\gui_exe\dataOutputFromEVM.bin

    You should also delete the following .xlsx files generated in the same directory by the parser utility, before running the data capture.

    dataOutputFromEVM_RP.xlsx, dataOutputFromEVM_Summary.xlsx, dataOutputFromEVM_vitalstats.xlsx

    I tried a new data capture after deleting the above files and was able to get the correct number of frames after parsing it.

    Hope that helps.

    Regards

    -Nitin