This thread has been locked.

If you have a related question, please click the "Ask a related question" button in the top right corner. The newly created question will be automatically linked to this question.

AWR1642BOOST: + DCA1000 EVM ::: mmwave studio Range FFT :: Peak at zero range

Part Number: AWR1642BOOST
Other Parts Discussed in Thread: AWR1642

hi,

I am learning TI mmwave sensors using AWR1642 (ES2.0) + DCA1000 EVM with a Windows 10 laptop and mmwave Studio 02.00.00.02. I am collecting 2x complex data from the ADC.

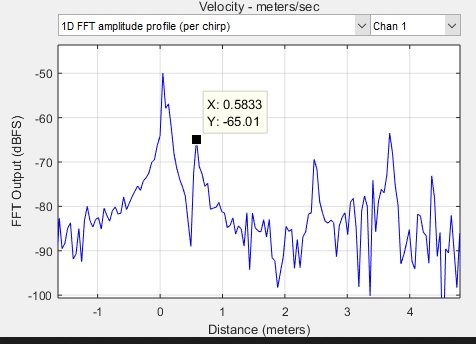
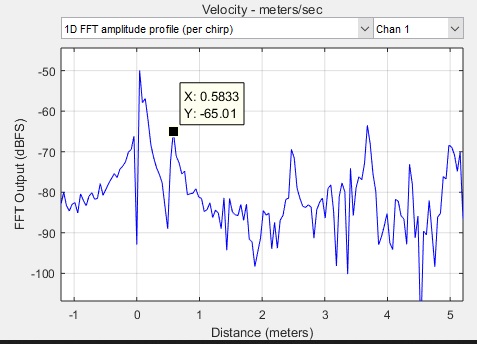
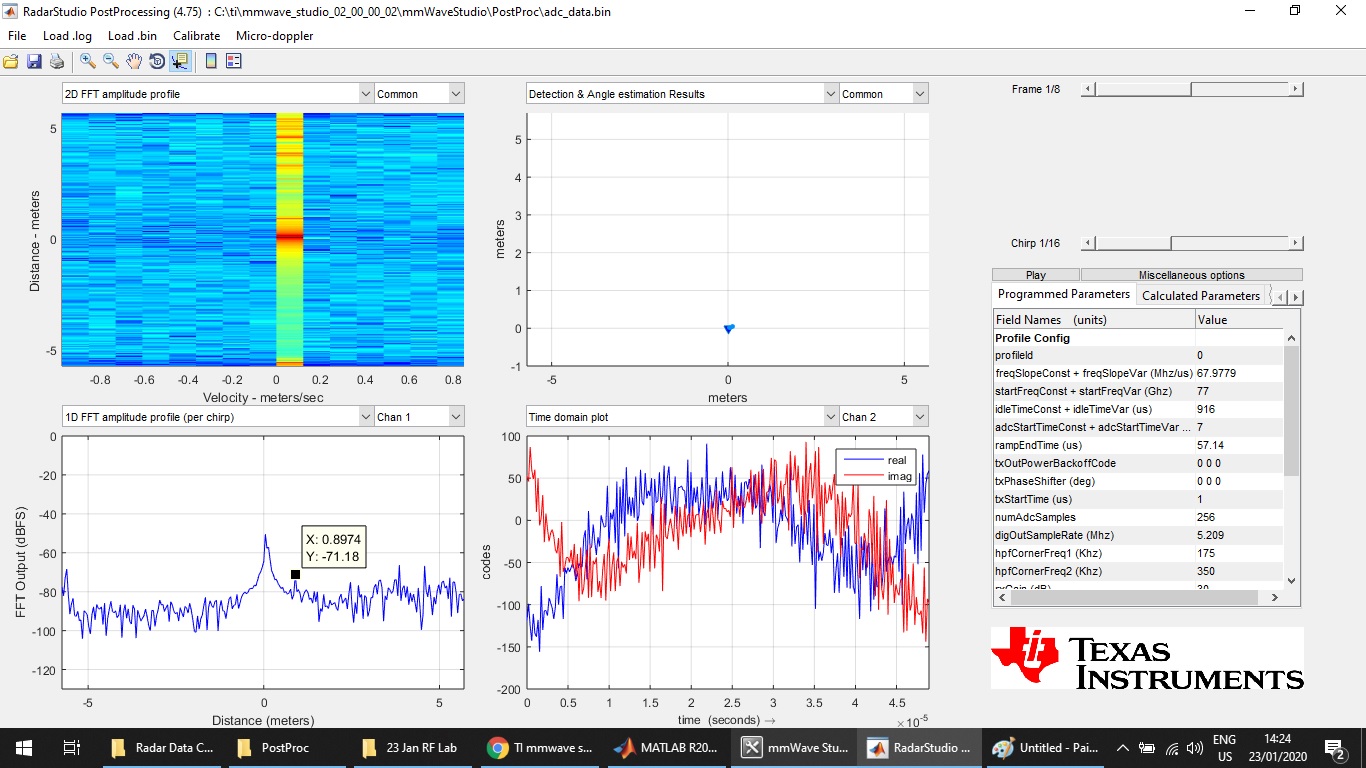
Almost virtually always, when I study Range FFT in post processing by mmwave Studio, I find a peak that starts from Range 0 and decays gradually. The Range profile (inclduing noise floor and and target peaks) is clear to me and I understand it.

But I am not clear why this initial peak is always occurring at 0 range ? I am attaching a sample figure of Post Processing Window screen shot. Please ignore the data tip and please just consider the peak at 0 range and advise possible cause(s) / phenomenon for its occurrence.

Thanks and regards

  • The peak in range bin 0 is due to Rx/Tx coupling

    thank you

    Cesar

  • Hi Cesar,

    Thank you for your reply, however, I have a few queries about it. You said " The peak in range bin 0 is due to Rx/Tx coupling ". After your reply and indication towards the cause, I searched the TI website and found following good and relevant posts ( I am mentioning them for my reference and for those who have similar query like me):

    https://e2e.ti.com/support/sensors/f/1023/t/783763?AWR1843-Why-block-points-cloud-when-range-less-than-0-25m-in-SDK-demo

    https://e2e.ti.com/support/sensors/f/1023/t/776876?tisearch=e2e-quicksearch&keymatch=coupling

    https://e2e.ti.com/support/sensors/f/1023/t/817780?tisearch=e2e-sitesearch&keymatch=IWR1443BOOST

    1-  Although i prefer not to work on TI mmwave Demo Visualizer and I prefer and I am working on TI mmwave Studio and I try to work on the ADC data acquired through DCA1000 EVM, yet, after going through above posts, I referred the user guide of mmwave SDK at C:\ti\mmwave_sdk_03_03_00_03\docs and I referred CLI command " calibDcRangeSig " which states that " Antenna coupling signature dominates the range bins close to the radar. These are the bins in the range FFT output located around DC. "

    From the above posts, I also referred the profile_2d config at " C:\ti\mmwave_sdk_03_03_00_03\packages\ti\demo\xwr16xx\mmw\profiles ". 

    I learnt that the CLI command " cfarFovCfg  " is used to exclude the data from the range bins that lie quite near to the radar and in the profile_2d config, data received from the range bins that lie from 0 to 0.25 m from the radar , is discarded. (Note : This command also gives limit for discarding data beyond an upper limit of range as well).

    From this, I understand that TI recommends 0.25 m as the minimum distance for placing a target. Can I assume it as a general recommendation for avoiding Rx/Tx Antenna coupling ? 


    2-  I further learnt that CLI command " CLI command " calibDcRangeSig "  of TI mmwave SDK calculates the DC signature from the number of range bins dictated in this command and then it removes the DC signature level from the SUBSEQUENT bins (and it does not remove this calcualted DC signature from the range binds defined int his command).

    However, CLI command " calibDcRangeSig " cannot / does not remove the relatively broader peak occurring at 0 range bin and adjacent closer bins in the range profile. Is my understanding right ?


    3-  Today, I did a little experiment with TI mmwave studio. I did not use any Window operation. For a certain target and parameters configuration, I obtained the following figure:


    Then, I used the "remove DC" option from the Miscellaneous options of mmwave studio and I obtained the following figure:


    I am unable to see any observable difference between the two plots except that a vertical line now appears at 0 range after removal of DC. Can you please explain this? Furthermore, I dont see that the operation defined by calibDcRangeSig of SDK is performed for DC removal in mmwave Studio.

    Are CLI command calibDcRangeSig of mmwave SDK, and, DC removal option of mmwave Studio two different things? If yes, then can you please elaborate the difference ? 

    4- Can you please elaborate a bit more on Rx/Tx coupling and / or advise some TI document(s) which address this issue in somewhat detail ?

    5- Can you say that this peak at 0 range will ALWAYS be there and can we say that it is a normal behaviour ?

    6- In continuation of question no. 5 above, are there some way(s) to remove this peak at 0 range ? If yes, then please advise about them ?

    7- Is their any relation for the width and height of this peak against the range or frequency or some other parameter ? I mean that can we estimate and predict the width of this peak from some parameters of TI mmwave sensors or scene parameters ? This question is important because then, I must realize this fact that I will not be probably able to detect a target if it falls within the the area under this peak at 0 range bin?

    Thanks and regards.

  • Answer #1

    Yes, this is general recommendation

    Answer #2

    Yes, your understanding is correct. The DC removal only removes the DC from the input signal

    Answer #3

    In your experiments, after DC removal is applied , you still see a peak at short range. This is due to Antenna Coupling.

    Please see following thread for more details about DC removal implementation in the mmWave Studio matlab function

    The DC removal implemented in the mmWave SDK demo (CLI command " calibDcRangeSig ") functions as described in the demo.

    Answer #4

    Please serch "Rx Tx Antenna Coupling" on the internet. This is a common Antenna Theory topic

    Answer #5/6

    Antenna Rx TX coupling will always be present

    There is research around how to compensate for that that in signal processing. Please search the litterature. We don't have any specific documentation

    Answer #7

    This is correct, if you are trying to observe a short range object that falls into the first range bins there will be challenges detecting it if the peak generated by the object is smaller than the peak due to coupling.

    We have not done research about the width of the peak

    thank you

    Cesar