This thread has been locked.

If you have a related question, please click the "Ask a related question" button in the top right corner. The newly created question will be automatically linked to this question.

IWR6843AOPEVM: high accuracy lab - plots do not match

Part Number: IWR6843AOPEVM

Hi,

Im using  MMWAVEICBOOST carrier board and  IWR6843AOPEVM as the antenna module board.

I've flashed the high accuracy binary and using the high accuracy visualizer for testing.

I've s 
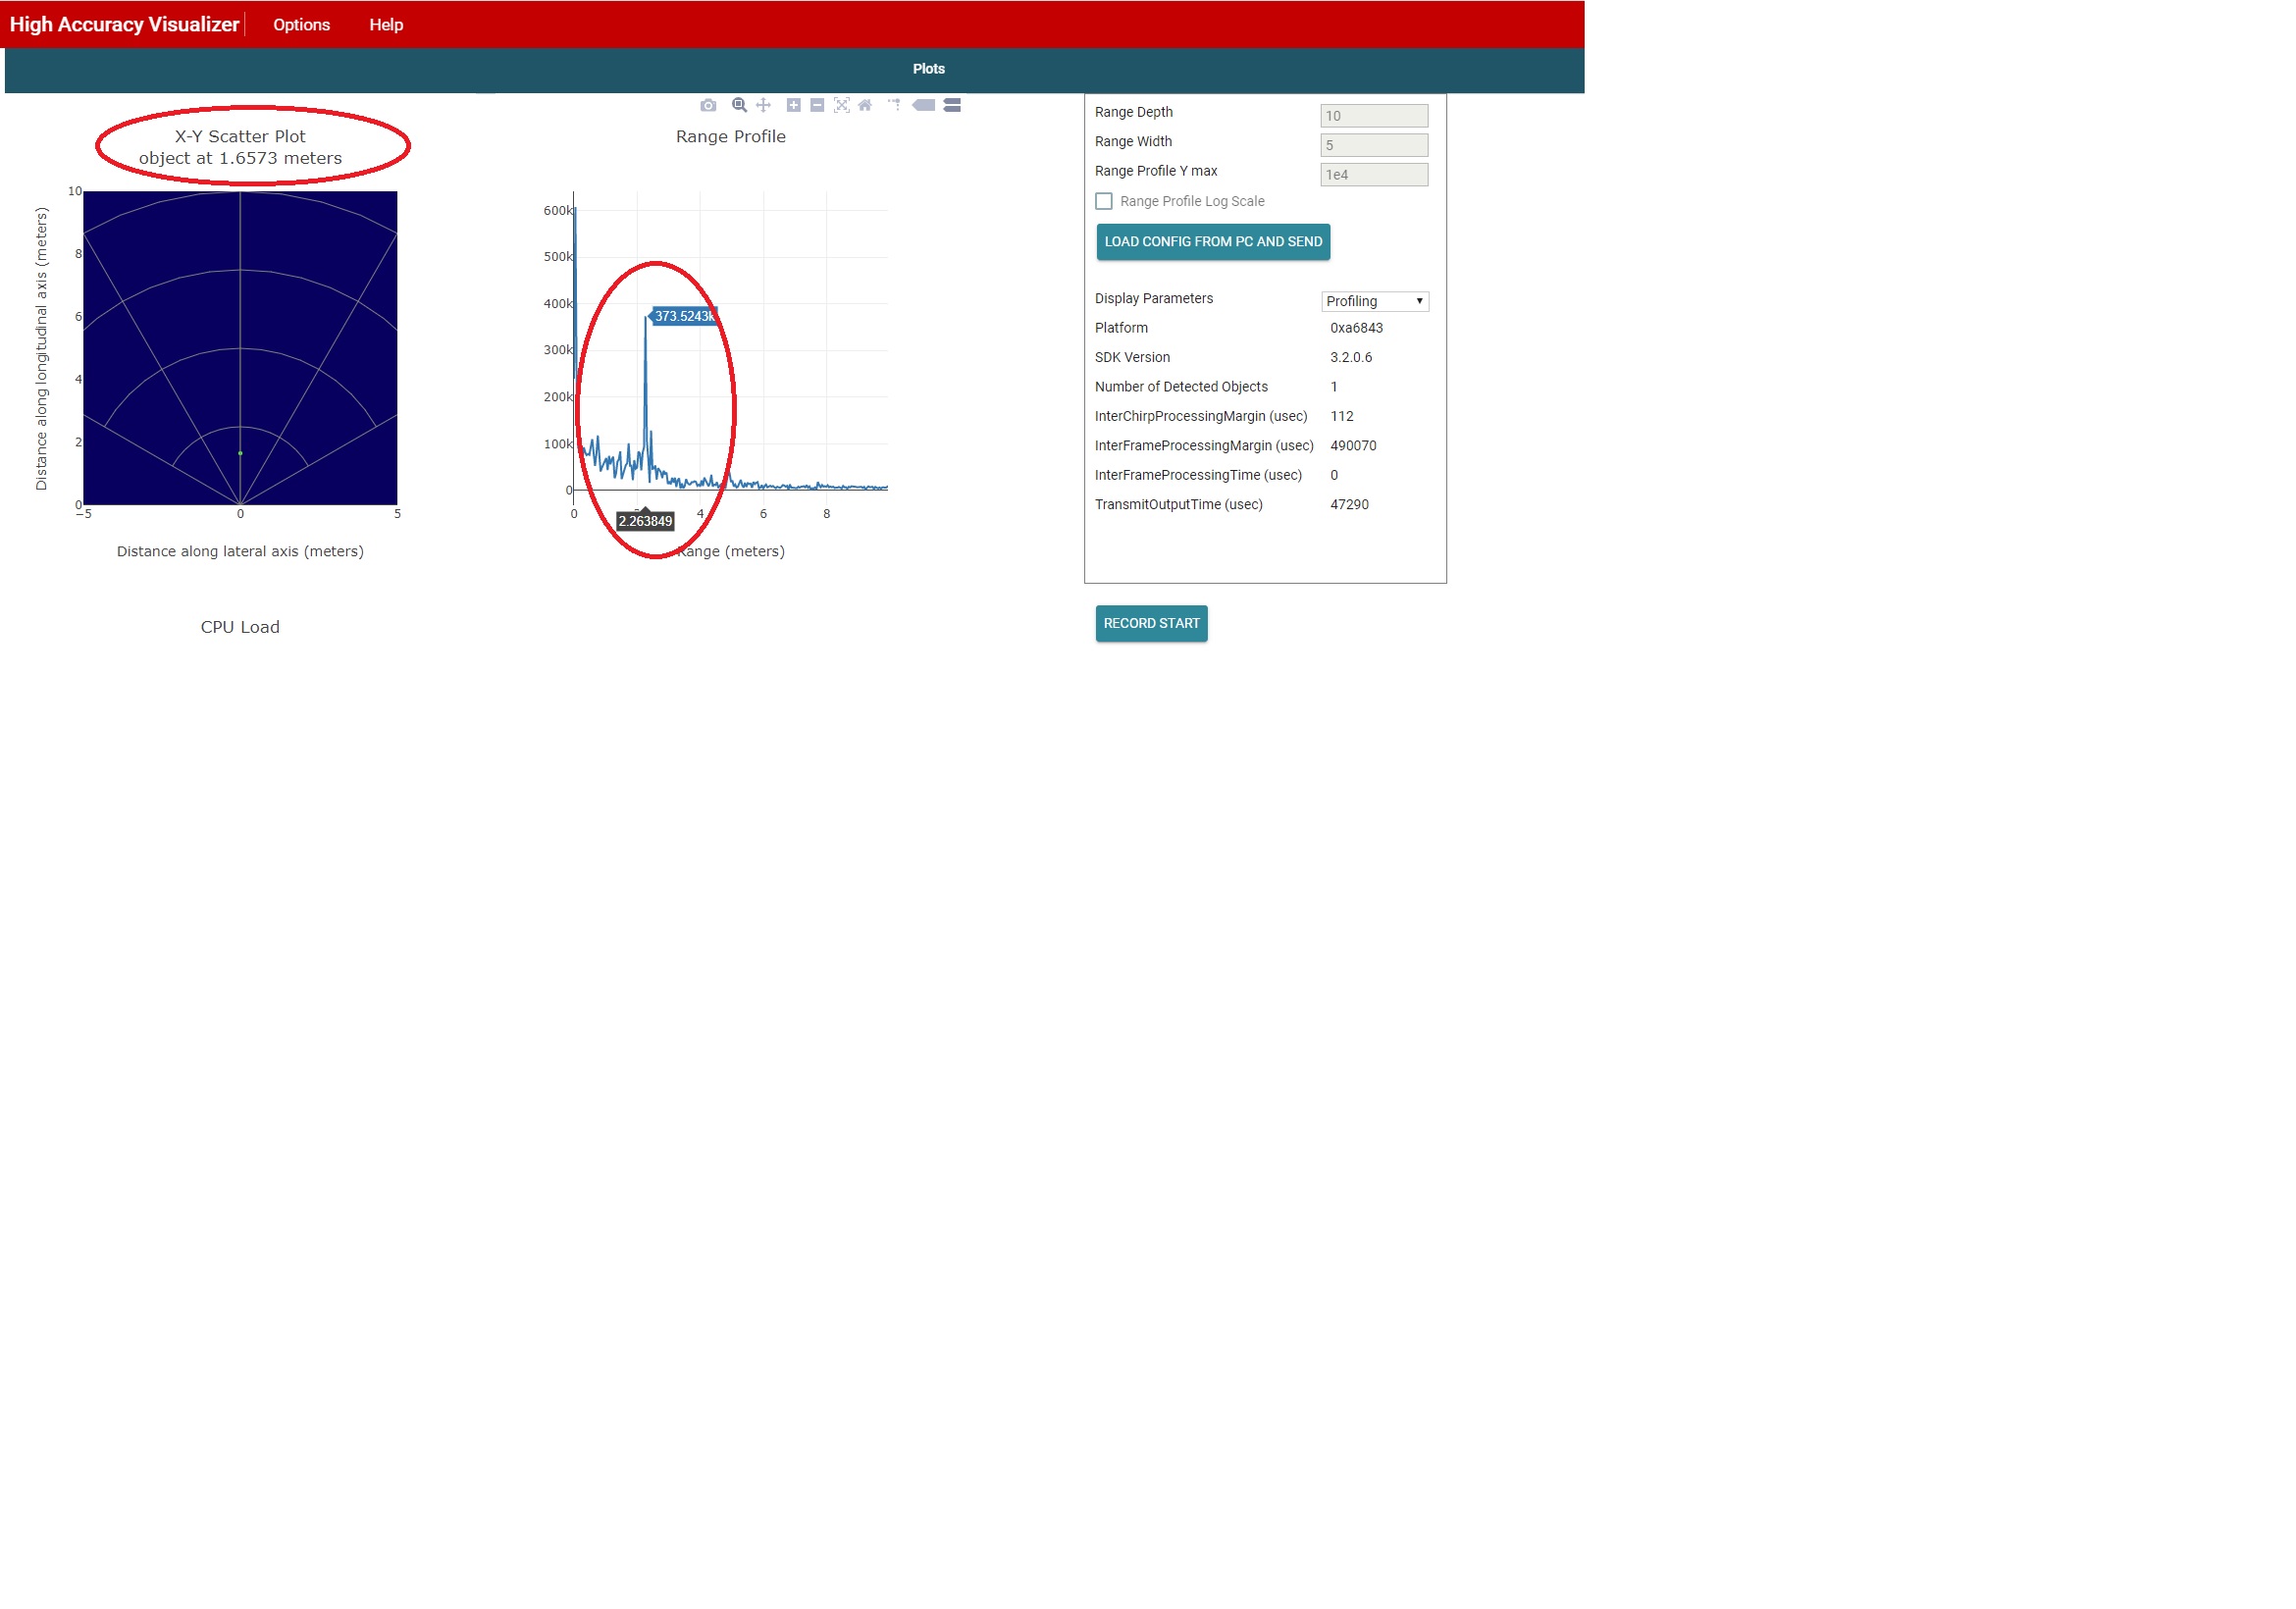
etup the radar in front of a wall at a distance of 2.16(m). I can see the returned echo very clearly on the range profile plot but the distance in the x-y scatter plot is quit different.

if I test in front of the wall at a distance of 0.7(m)  the error is smaller but still there. 

am I missing some configuration?

I saw an open ticket on a different platform and I think I see the same issue but the is no resolution to the problem (although ticket is resolved) - https://e2e.ti.com/support/sensors/f/1023/t/869499?tisearch=e2e-sitesearch&keymatch=range%2520profile%2520and%2520x-y%2520scatter%2520dont%2520match

Thanks,

Guy

  • Hi Guy,

    Thank you for reporting this. This is a known issue which has been now been resolved.

    Please use the respective visualizer as in this post.

    Cheers,

    Akash

  • Hi Akash,

    Thanks a lot for the quick response.

    With the new visualizer, the plots do match but now I get an offset in my distance measurements.

    the offset increases over object distance:

    object at 0.14m --> measurement in visualizer shows 0.19m.

    object at 0.72m --> measurement  in visualizer shows 0.78m.

    object at 2.16m --> measurement in visualizer shows 2.25m.

    I was able to fix this in the OOB demo by using  compRangeBiasAndRxChanPhase & measureRangeBiasAndRxChanPhase but those 2 commands are not available in the high accuracy src code. 

    is there another way to calibrate or do you think this is related to an other issue?

    Thanks,

    Guy 

  • Hi Guy,

    Do you have any pictures of your test setup or screenshots on your findings?

    There are definitely numerous sources that can contribute to this discrepancy. Perhaps the biggest are external disturbances, things such as walls or tables and also vibration near where the EVM has been set.

    Another source could be the object you are measuring as highly reflective objects provide a higher SNR which results in a more accurate measurement. Some more information about your test setup and procedure would be helpful in determining this.

    Cheers,

    Akash

  • Hi Akash,

    Our goal is to test the mmwave as a level sensing device in our application.

    To verify the basic capabilities of the device, I've placed the board in front of the wall, 110cm above the ground and repeated this test in 3 different distances (30cm, 70cm, 200cm).

    I cant see any other high reflection object in the range profile except for the wall and it's reflection is very high.

    As you can see in the attached pic's, the offset increases over distance:

    1. Setup of 30cm between sensor and wall --> returned object distance on visualizer is 34 cm. 

    2. Setup of 70cm between sensor and wall --> returned object distance on visualizer is 76 cm.

    3.  Setup of 200cm between sensor and wall --> returned object distance on visualizer is 209 cm.

    Thanks,

    Guytest.rar

  • Hi Akash,

    Did you get a chance to look at the pic's?  Any idea on how to calibrate the offset I see?

    Thanks,

    Guy

  • Hello Guy,

    Thank you for sharing your results with us. I will need a little bit of time to look into this.

    Will have an update for you early next week.

    Cheers,

    Akash

  • Hi Akash,

    Any updates?

    Thanks,

    Guy

  • Hello Guy,

    With a fixed mounting mechanism and lensing it is possible to achieve around 1 mm of accuracy especially with the at the distances you have tested above. The inaccuracy is likely the result of either some disturbances in your scene or some vibration around your sensors.

    Regards,

    AG