This thread has been locked.

If you have a related question, please click the "Ask a related question" button in the top right corner. The newly created question will be automatically linked to this question.

HDC2010: Max temperature accuracy vs temperature

Part Number: HDC2010

Hi team,

My customer interested in HDC2010 now.

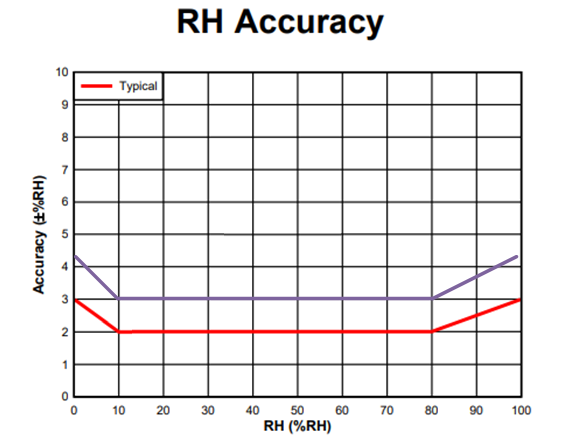
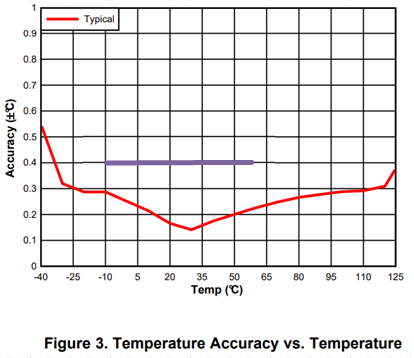
The customer requested us to max accuracy vs  temperature graph and max RH accuracy vs RH graph.

We can see typical value in the datasheet figure 2 and 3.

Could you please provide the max value graph?

Regards,

Yoshi

  • Dear Yoshi, 

    the max graph line would cover same operating range typical is specified for, purple line below represents that, from what is specified in. 

    in same scenario, from what datasheet specifies for temp (between 5 and 60C) is shown below.