This thread has been locked.

If you have a related question, please click the "Ask a related question" button in the top right corner. The newly created question will be automatically linked to this question.

IWR6843ISK-ODS: IWR6843ISK-ODS: mmWave Demo Visualizer 1.0.0 problem , "There is no response object in the Plots "

Part Number: IWR6843ISK-ODS
Other Parts Discussed in Thread: IWR6843

Hi sir,

I have been trying my hands on the mmWaveBoost+IWR6843ISK-ODS by running the basic ODS Point Cloud Demo. I followed all the instructions which were mentioned in the TI Resource Explorer. and I have flashed the the binary firmware into the EVM  as well.

All the Software setup are as lists:

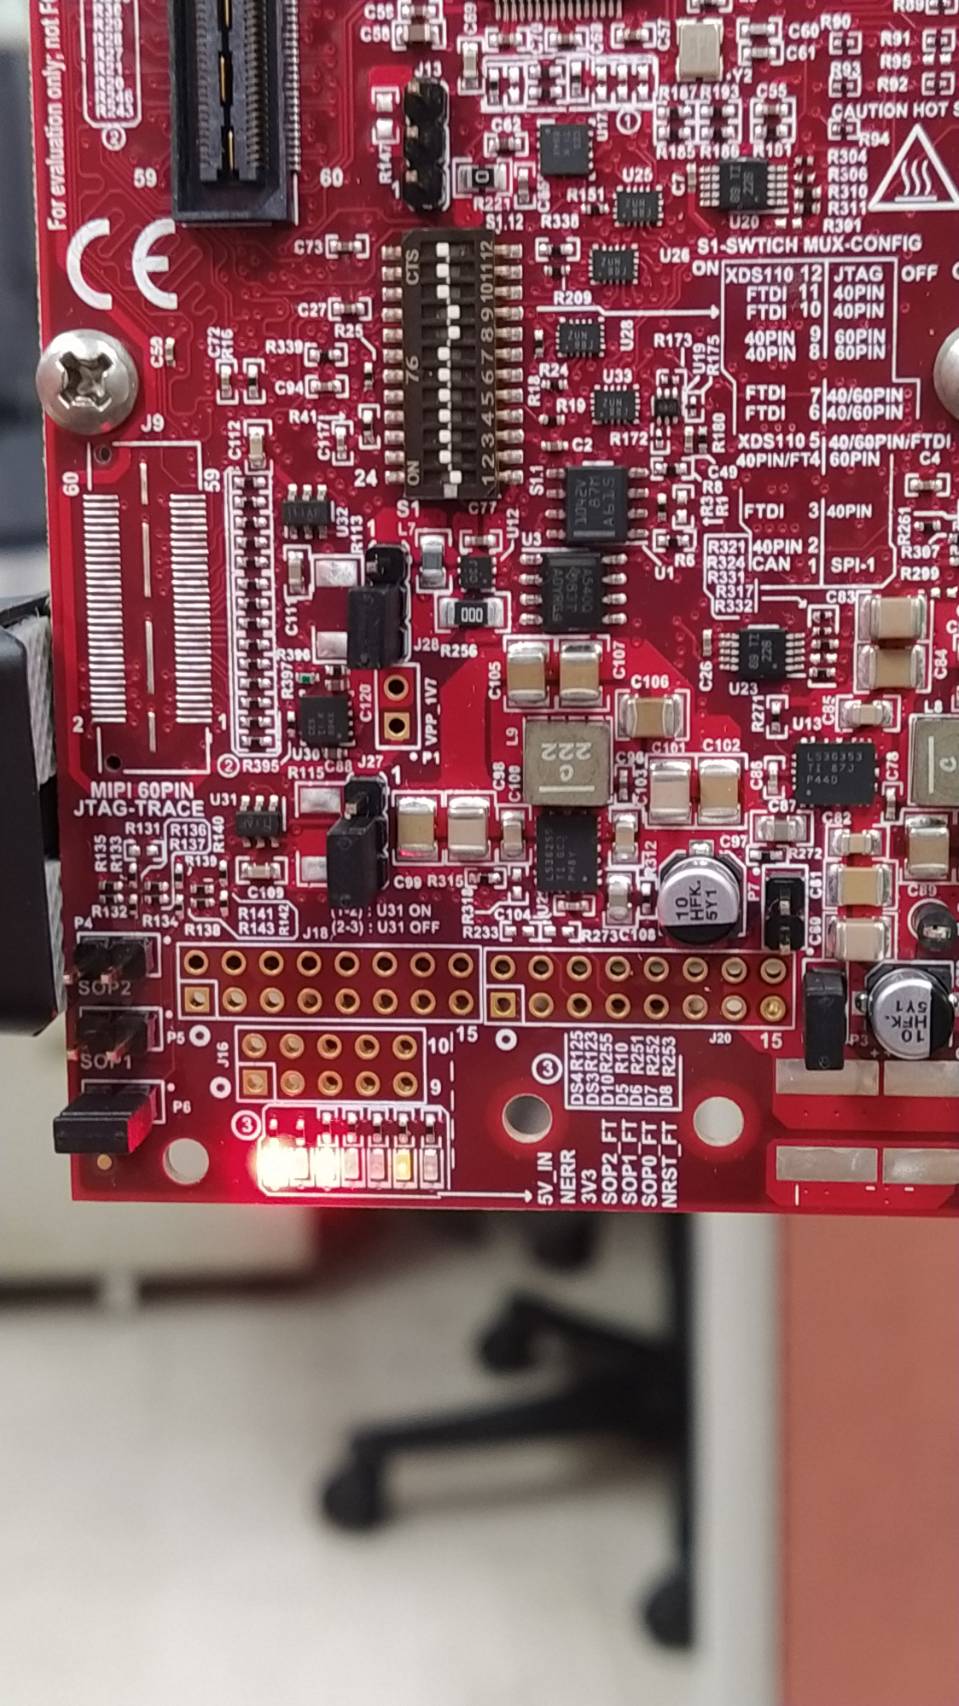
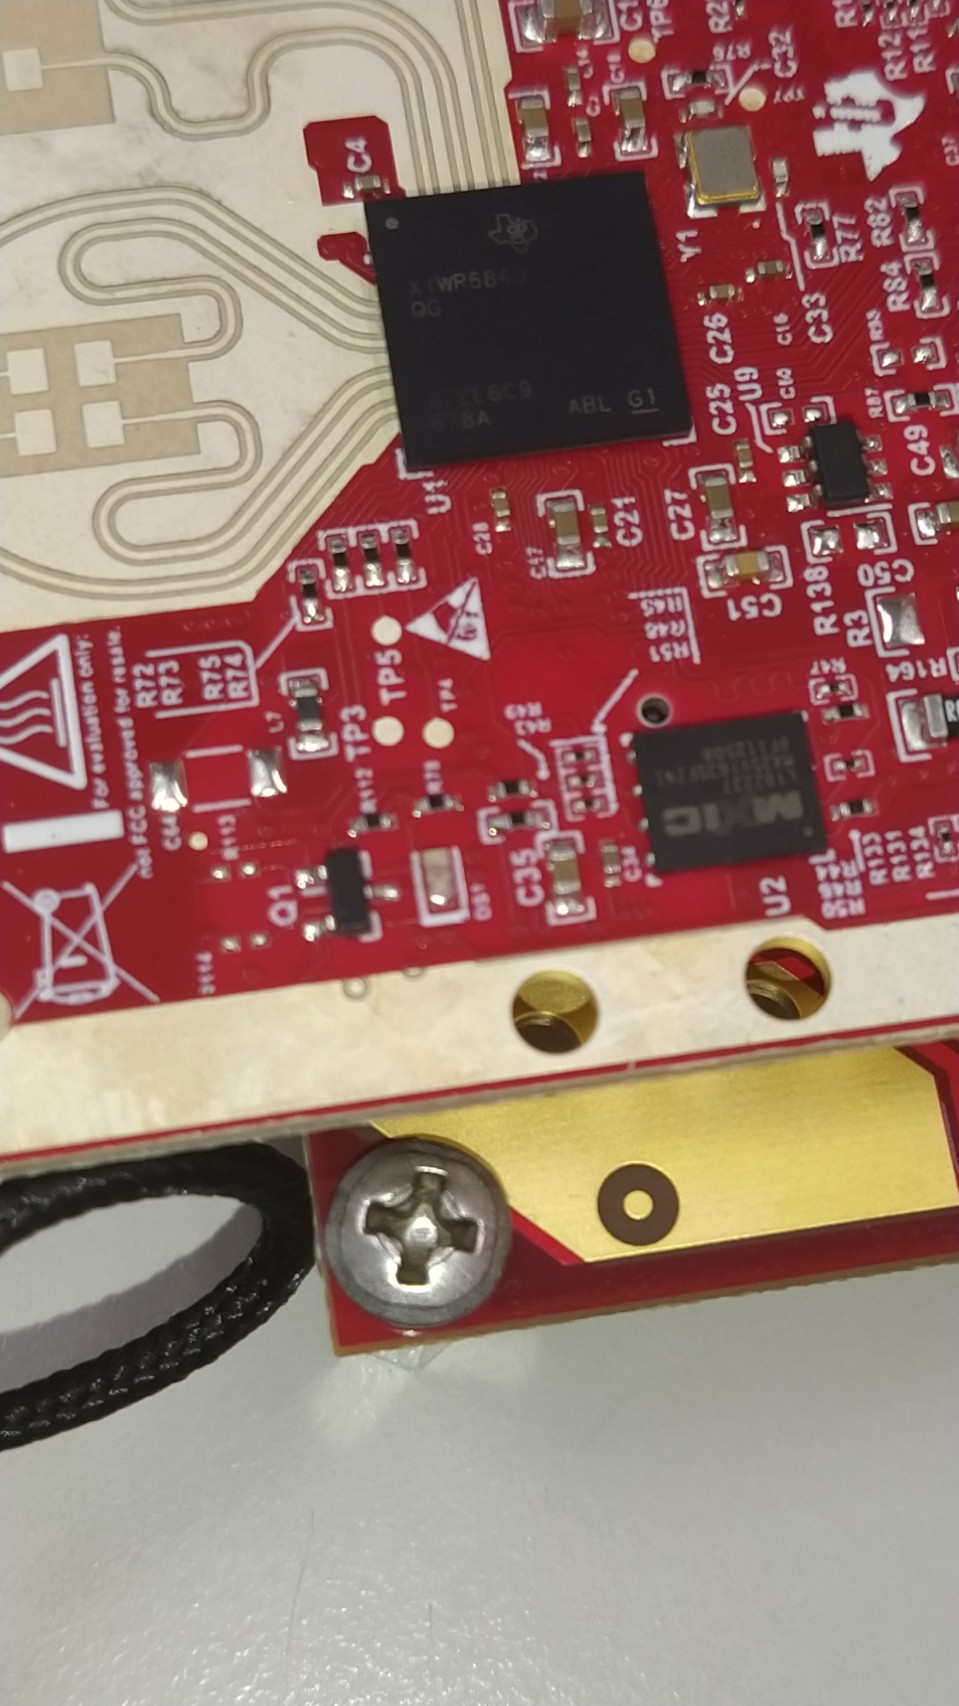
  -EVM: mmWaveBoost card + IWR6843ISK-ODS (ES2 device)

  -Toolbox:  mmwave_industrial_toolbox_4_2_1

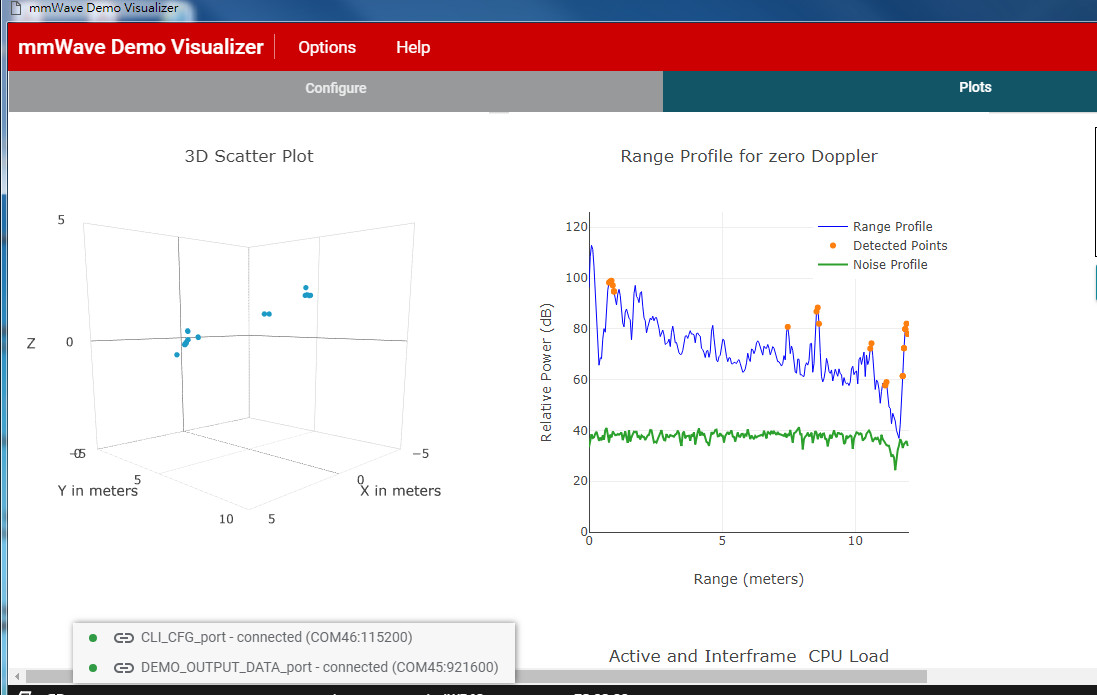
  - GUI: mmWave Demoe Visualizer V1.0.0 (IR6843AOP) 

  - Binary file: ods_point_cloud_68xx.bin @mmwave_industrial_toolbox_4_2_1\labs\out_of_box_demo\68xx_ods_point_cloud_demo\prebuilt_binaries

  - Config file: profile_iwr6843_ods_3d.cfg  @mmwave_industrial_toolbox_4_2_1\labs\out_of_box_demo\68xx_ods_point_cloud_demo\chirp_configs

  Also , I have "connected the serial port" and "Load the Config file" successfully


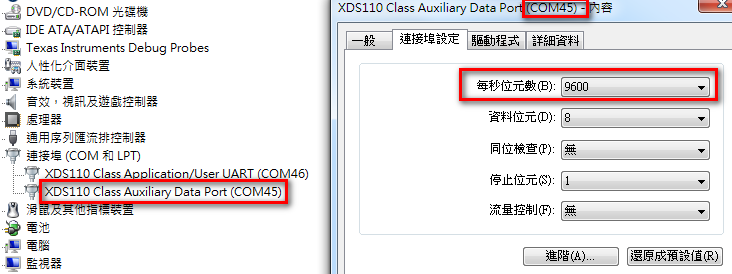
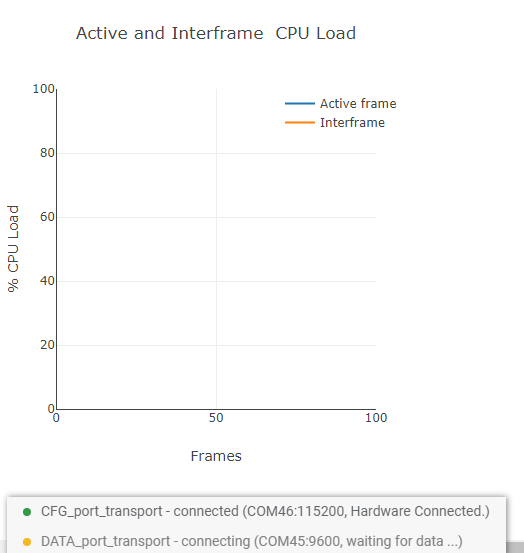
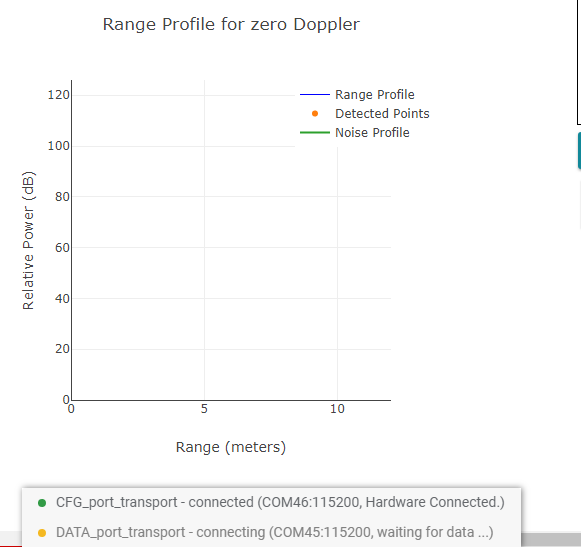
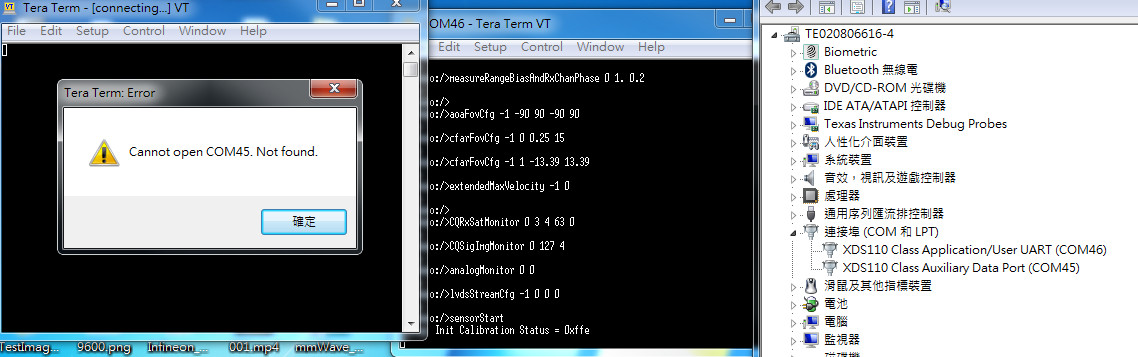
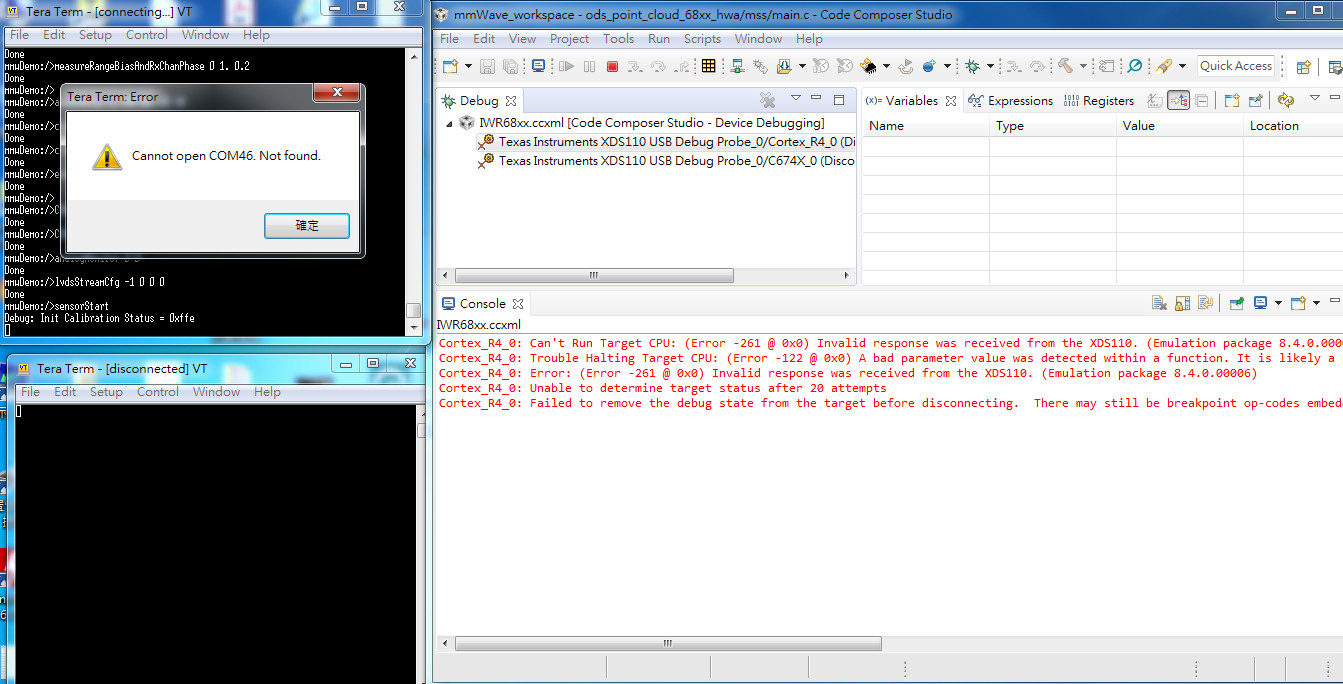
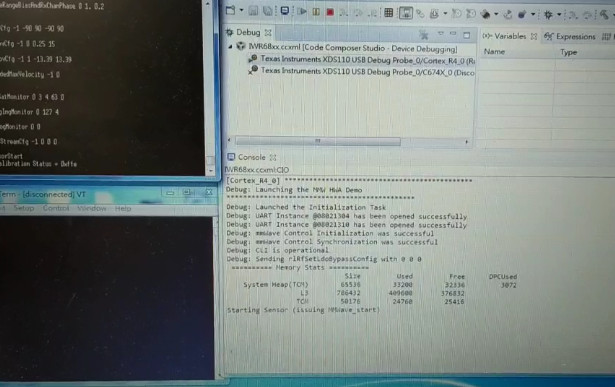
  but I can't see any response object in the Plot view and he status bar , Uart port showed Hardware Connected but data port still waiting the data .


  I also provide the console log  , please help us to see this problem and give the suggestion , thanks!
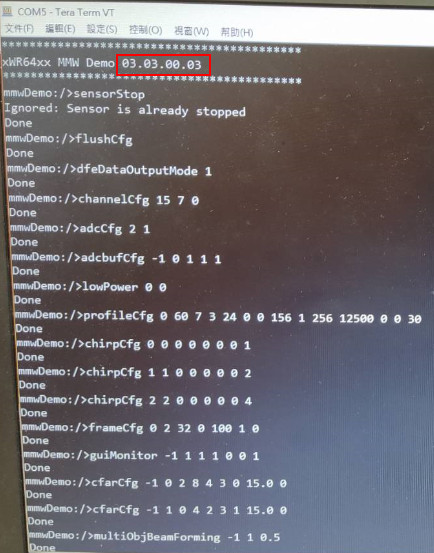
   

---------------------------------------------------------------------------

Console Log :

---------------------------------------------------------------------------

mmwDemo:/>% Carrier frequency GHz 60
Skipped

mmwDemo:/>% Ramp Slope MHz/us 156
Skipped

mmwDemo:/>% Num ADC Samples 256
Skipped

mmwDemo:/>% ADC Sampling Rate Msps 12.5
Skipped

mmwDemo:/>% ADC Collection Time us 20.48
Skipped

mmwDemo:/>% Extra ramp time required (start time) us 3
Skipped

mmwDemo:/>% Chirp time (end time - start time) us 21
Skipped

mmwDemo:/>% Chirp duration (end time) us 24
Skipped

mmwDemo:/>% Sweep BW (useful) MHz 3194.88
Skipped

mmwDemo:/>% Total BW MHz 3744
Skipped

mmwDemo:/>% Max beat freq (80% of ADC sampling rate) MHz 10
Skipped

mmwDemo:/>% Max distance (80%) m 9.62
Skipped

mmwDemo:/>% Range resolution m 0.047
Skipped

mmwDemo:/>% Range resolution (meter per 1D-FFT bin) m/bin 0.047
Skipped

mmwDemo:/>%
Skipped

mmwDemo:/>% Inter-chirp duration us 7
Skipped

mmwDemo:/>% Number of chirp intervals in frame - 96
Skipped

mmwDemo:/>% Number of TX (TDM MIMO) 3
Skipped

mmwDemo:/>% Number of Tx elevation antennas 0
Skipped

mmwDemo:/>% Number of RX channels - 4
Skipped

mmwDemo:/>% Max umambiguous relative velocity kmph 48.19
Skipped

mmwDemo:/>% mileph 30.12
Skipped

mmwDemo:/>% Max extended relative velocity kmph 144.56
Skipped

mmwDemo:/>% mileph 90.35
Skipped

mmwDemo:/>% Frame time (total) ms 2.976
Skipped

mmwDemo:/>% Frame time (active) ms 2.304
Skipped

mmwDemo:/>% Range FFT size - 256
Skipped

mmwDemo:/>% Doppler FFT size - 32
Skipped

mmwDemo:/>% Radar data memory required KB 400
Skipped

mmwDemo:/>% Velocity resolution m/s 0.84
Skipped

mmwDemo:/>% Velocity resolution (m/s per 2D-FFT bin) m/s/bin 0.84
Skipped

mmwDemo:/>% Velocity Maximum m/s 13.39
Skipped

mmwDemo:/>% Extended Maximum Velocity m/s 40.16
Skipped

mmwDemo:/>% Maximum sweep accorss range bins range bin 0.85
Skipped

mmwDemo:/>%
Skipped

mmwDemo:/>sensorStop
Ignored: Sensor is already stopped

Done

mmwDemo:/>flushCfg
Done

mmwDemo:/>dfeDataOutputMode 1
Done

mmwDemo:/>channelCfg 15 7 0
Done

mmwDemo:/>adcCfg 2 1
Done

mmwDemo:/>adcbufCfg -1 0 1 1 1
Done

mmwDemo:/>lowPower 0 0
Done

mmwDemo:/>profileCfg 0 60 7 3 24 0 0 156 1 256 12500 0 0 30
Done

mmwDemo:/>chirpCfg 0 0 0 0 0 0 0 1
Done

mmwDemo:/>chirpCfg 1 1 0 0 0 0 0 2
Done

mmwDemo:/>chirpCfg 2 2 0 0 0 0 0 4
Done

mmwDemo:/>frameCfg 0 2 32 0 100 1 0
Done

mmwDemo:/>guiMonitor -1 1 1 1 0 0 1
Done

mmwDemo:/>cfarCfg -1 0 2 8 4 3 0 15.0 0
Done

mmwDemo:/>cfarCfg -1 1 0 4 2 3 1 15.0 0
Done

mmwDemo:/>multiObjBeamForming -1 1 0.5
Done

mmwDemo:/>calibDcRangeSig -1 0 -5 8 256
Done

mmwDemo:/>clutterRemoval -1 0
Done

mmwDemo:/>compRangeBiasAndRxChanPhase 0.0 -1 0 1 0 1 0 -1 0 -1 0 1 0 1 0 -1 0 -1 0 1 0 1 0 -1 0
Done

mmwDemo:/>measureRangeBiasAndRxChanPhase 0 1. 0.2
Done

mmwDemo:/>aoaFovCfg -1 -90 90 -90 90
Done

mmwDemo:/>cfarFovCfg -1 0 0.25 15
Done

mmwDemo:/>cfarFovCfg -1 1 -13.39 13.39
Done

mmwDemo:/>extendedMaxVelocity -1 0
Done

mmwDemo:/>CQRxSatMonitor 0 3 4 63 0
Done

mmwDemo:/>CQSigImgMonitor 0 127 4
Done

mmwDemo:/>analogMonitor 0 0
Done

mmwDemo:/>lvdsStreamCfg -1 0 0 0
Done

mmwDemo:/>sensorStart
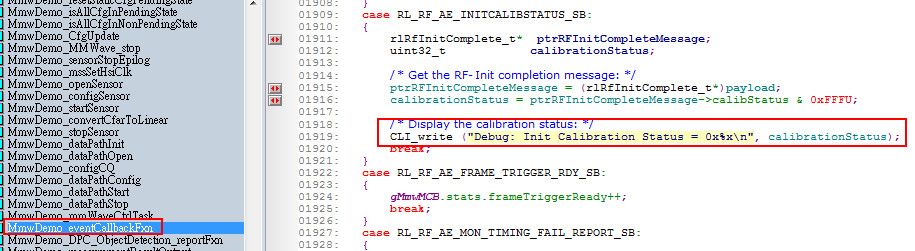
Debug: Init Calibration Status = 0x1e

---------------------------------------------------------------------------

  • Dear Wenyu:

    With other demos I have had similar issues with the point clouds not appearing after what appears to be a successful configuration. From my experience this points to an issue with the COM ports. I would suggest for right now that you go through all the steps in the demo's user guide and take extra precaution with regards to making sure that you use the Device Manager in Windows to make sure that you know which COM port is for configuration ( 115200 baud rate) and which one is for data ( 921600 baud rate) and see where this lands you. If this does not work reply to this post and we can adjust how we tackle your issue.

    Best regards,

    Connor Desmond

  • Hi Desmond ,

     Thank for your reply , I tried your suggest steps and check the COM port setting use the Device Manager in Windows .

     - COM46 is CFGPort with 115200 baud rate

      -COM45 is DataPort with 9600 baud rate. (It's not  recommend 921600 , and there is no 921600 option)  

      so I tried running the Demo to connect  data port(COM45) with 9600 , the issue still present.

      then also adjust to 115200  in the Device Manager , and running the Demo data port with 115200, the issue still present.   

      If you have any idea , please also give us the recommand baudrate setting in Device Manager when your next suggestion way , thanks.


  • Dear Wenyu:

    By default if you go into the COM port properties and check the baud rate it will be at 9600. All the that the Device Manager is needed for is so that you know which port is for configuration and which one is for data e.g. COM46 and COM 45. What is important is on the visualizer COM port setup. The CFG_port_transport and DATA_port_transport should show in the visualizer as 115200 and 921600. Once you get there check to see if any points are being displayed. If not then we can try some other things, but use the Point Cloud Demo for the 68xx ODS and follow instructions thoroughly. Also check to see if you have the SOP2 is in functional mode, and you cycle power after changing SOP2. Let me know how it goes.

    Best regards,

    Connor Desmond

  • Hi Connor , 

     I know the COM port which one is for data and which one is for configuration and I think the COM port Nubmer there in visualizer setting  I choose with no problem (with the default recommend baudrate).

     I did and followed by the instruction on document .Also I take the picture of the board below.  SOP2 set to be opened (function mode ).


     The problem now is at DATA PORT showed Connecting (COM45,921600 , waiting for data) , we got no data . 

     Please help guide us quick rule out this problem . thank you.

  • Hi Connor , 

    Do you have any suggestion ?

    thanks

    Ben.

  • Hello,

    Can you please  try the following:

    FOr ODS OOB demo that you are already trying:

     1.confirm if both the com ports are connected based on the status of the GUI on the left hand bottom of window.

    2. If #1 doenst work.  Try connecting the console using Tera Term for each of the com ports and see data coming over the screen,

    Additionally in order to make sure this is not a connectivity issue with the GUi, PC, board combination can you please try any other demo for this evm.

    eg: Area scanner Demo : http://dev.ti.com/tirex/explore/node?node=AJB5KNPj7oxrAxFIuIkhqA__VLyFKFf__LATEST

    Please share the results based on above tryouts.

    Thank you,

    Vaibhav

  • Hi Vaibhav , 

      1. the dataport status of the GUI are not connected .. it's in connecting.

      2.  I can't see the data come from dataport from console , but CFG port is OK , I can send command to EVM.

      3. yes , that OK in Area sacanner Demo .

    Might this issue from firmware binary ? can you provide the fix steps . 

    I need to develop the algorithm in the topic  "Detecting Human Falls and Stance with IWR6843ODS".

    please help give a guide and the reference project should be working on my hand kit.

    thanks.

    Ben.

    thanks.

  • HI Ben

    Good to know that board+PC combination is working now the debug can be focused solely on OOB demo + Visualizer.

    Continuing on the debug further: Please get response to the following

    1. For visualizer: Can you please try running the demo on a different PC to see if browser permission is not causing this.

    2. If #1 doesn't work.  Try connecting the console using Tera Term for each of the com ports and see data coming over the screen.

    Thank you,

    Vaibhav

  • Hi Vaibhav,

    my tryout result below:

     1. Other PC have same problem (I have tried on both Win10/win7 OS). My visullizer is installed the offline version , also I tried both online/offline network with same problem.

    2. For connecting via consle  ,

         -CFG port is OK , I can send command and got response to EVM 

        - but I can't see the message from data port.  

    Thanks

    Ben.

  • Dear Ben:

    In your top post you stated that you are using an ES2 device. Can you please verify that this is true per instructions given in the ODS Point Cloud Overview.

    Best regards,

    Connor Desmond

  • Hi Connor and Vaibhav,

     Thanks , Vaibhav support...

     I upload my test video ,

    I followed the eailier Vaibhav post instruction. 

     (Note. his work in ISK device and flashed  binary  "03.04.00.02" , it's not my using version and device)

    1)  I send command as in "profile_iwr6843_ods_3d.cfg" from CFG port using TeraTerm.

        but after sending sensorStart command ,I can't see the bunch of nonsensical characters respnse from data port using teraTerm.

    2) The binary SDK version was flashed to my device  as showed  below :


       3)it's ODS ES2 device.


    Thanks

    Ben.

  • Hi Cornnor , 

     As my above comment , I think this should be binary release issue. please provide your suggestion ASAP.

     My ODS ES2 device was flashed into binary  "ods_point_cloud_68xx.bin" provided by TI toolbox released ver.4.2.1.

       @mmwave_industrial_toolbox_4_2_1\labs\out_of_box_demo\68xx_ods_point_cloud_demo\prebuilt

     using the chips: "profile_iwr6843_ods_3d.cfg "

       @mmwave_industrial_toolbox_4_2_1\labs\out_of_box_demo\68xx_ods_point_cloud_demo\chirp_configs

      Please confirm these file with no problem in these toolbox release , and give the solution .

    Thx.

    Ben 


  • Dear Ben:

    We just released a new version of the SDK (3.4) and Industrial Toolbox(4.3). I would suggest getting those into your C:/ti folder and use the new ODS demo and see if you get stuck in the same place. Make sure that you use the user's guide from the new industrial toolbox very carefully. Remember when ever you take off the SOP2 jumper to always cycle power afterwards; it is easy to forget.

    Good luck,

    Connor Desmond

  • Hi Connor , 

     1)I have upgraded to industrial Toobox(4.3) , Visualizer (3.4) and SDK(3.4) for the OOB demo.

         Unfortunately, It still got stuck , the GUI show without point cloud data.

      2) I also check by TeraTerm , after I send chirp configuration command and send sensor start command ,  I could see the screen flash in Windows device manager due to com port re-connected  then the data COM disconnected in TeraTerm and can't be opened.

    3) Have you tried it in your side using ODS device ?

    4) Please report  to TI engineer  , and tell when will have fix 


    Ben.

  • Ben:

    I have ran the ODS demo personally following the instructions given in the User's Guide and got the demo to function properly.

    The next steps are as follows:

    1. From your last screenshot from Tera Term I can't see the final Done after "Init Calibration..." so please verify that it is there or is not.

    2. Use CCS to run the demo as prescribed in the Developer's Guide in the Demo's User Guide. This will use to better isolate where the problem is.

    Let me know your results and we will go from there.

    Best regards,

    Connor Desmond

  • Hi Connor , 

     1) Below is error in CCS debug console , and the debugging as in attaching video.

    Cortex_R4_0: Can't Run Target CPU: (Error -261 @ 0x0) Invalid response was received from the XDS110. (Emulation package 8.4.0.00006) 
    Cortex_R4_0: Trouble Halting Target CPU: (Error -122 @ 0x0) A bad parameter value was detected within a function. It is likely a problem with `SC_ARGS' in SMG_call(). (Emulation package 8.4.0.00006) 
    Cortex_R4_0: Error: (Error -261 @ 0x0) Invalid response was received from the XDS110. (Emulation package 8.4.0.00006) 
    Cortex_R4_0: Unable to determine target status after 20 attempts
    Cortex_R4_0: Failed to remove the debug state from the target before disconnecting. There may still be breakpoint op-codes embedded in program memory. It is recommended that you reset the emulator before you connect and reload your program before you continue debugging

    2) For your Q1 , Where is the code line you said the "final done" ? I only find  the return of "Calibration status" in Mmwave_eventCallbackFxn()@main.c . 

        and What is the calibration status : 0xffe meaning ?

    Thanks

    Ben.

  • Ben:

    When placing the entire .cfg file (which contains all of the CLI commands) please try the following or verify that you have done this.

    In Tera Term after you have set up your serial port go to the "Setup" Tab on the top of the window. Then you will go to "Serial port". There I want you to modify the fields in the "Transmit Delay" portion of the window. Set msec/char = 5 and msec/line = 50. Also try msec/line = 100 as well. This at least has to be done so the device has enough time to send "Done" back to the COM port. 

    Let me know how this goes.

    Best regards,

    Connor Desmond

  • Hi Connor ,

     I try it but that still not work.  What is the ok done back log from debug console ?  can you post it..

    Below is the final log in debug console before the COM port show disconnected.

    Thanks

    Ben.

  • Ben:

    I am going to reach out to some of my colleges about your situation and continue to assist you in the following days.

    Best regards,

    Connor Desmond

  • Hi Connor ,

    I just have anther thread for other demo debugging , I got the suggestion to change my power adapter ( caused by my adapter 5/v/3A is not good quality, not enough to 3A) 

     this issue is resolved , I can use this point count demo , thank for your help and support.

    Thanks

    Ben.