This thread has been locked.

If you have a related question, please click the "Ask a related question" button in the top right corner. The newly created question will be automatically linked to this question.

CCS/IWR6843ISK: Vital Sign Demo Questions - Phase Unwrapping

Part Number: IWR6843ISK

Tool/software: Code Composer Studio

Hi.

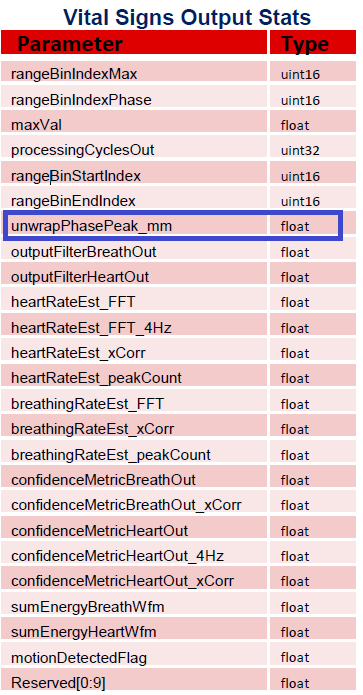
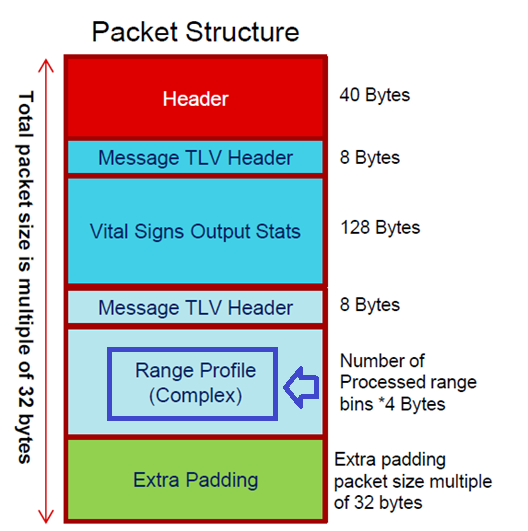
We used TI's phase unwrapping algorithm by changing it to Python code.

And I have a few questions.
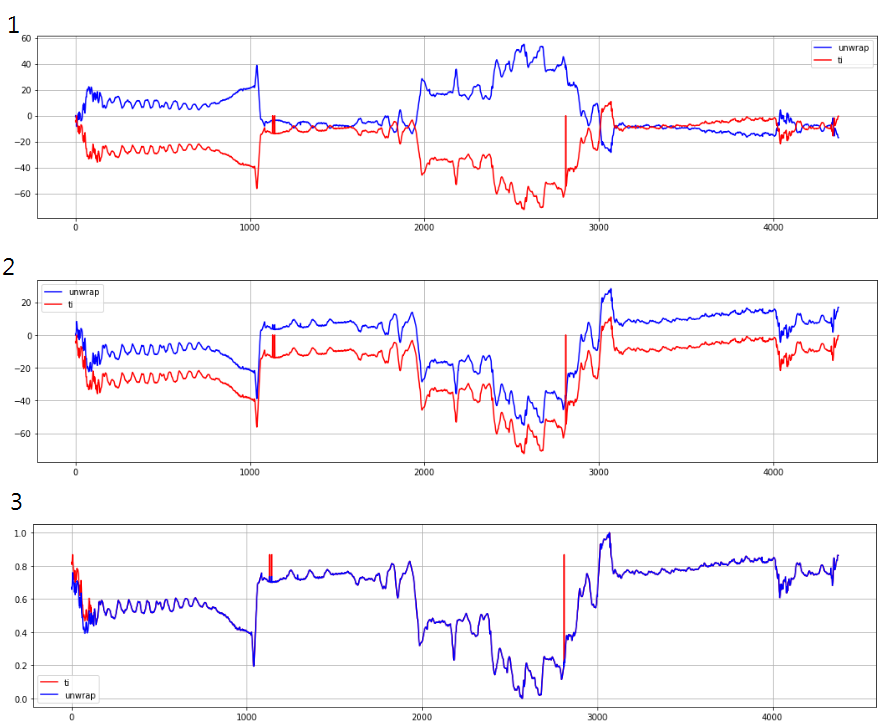
picture 1.

  Q1. Why does it look upside down? 

picture 2.

  Q2. Why are the scales different?


picture 3.

  Q3. Why are the beginnings different?

  Q4. Why does the middle part bouncing?

Best regards

CH Cho.

  • HI,  CH Cho:

    What is the difference between red and blue curve?  Are they exactly based on the same data? 

    Please give more details.  

    Best,

    Zigang

  • Blue is the graph where we unwraped the bin's img and real values.

    Red is unwraped from mmwave firmware.

    The two data are from the exactly same bin and same time.

    Picture 1 is after unwrapping with the python code.(blue)

    Picture 2 is the picture that flipped the unwrapping data.(blue)

    Picture 3 normalizes the two data.

  • Sorry, I still do not understand.  Can you explain with details?  How the data is obtains and what kinds of process is used?

    what is unwrap mean in your sentence below? what is the bin? raw ADC data?

    Blue is the graph where we unwraped the bin's img and real values.

    Best,

    Zigang

  • I converted the unwrap function of Vital signs lab to Python code.

    float unwrap(float phase, float phasePrev, float *diffPhaseCorrectionCum)
    {
    	float modFactorF;
    	float diffPhase;
    	float diffPhaseMod;
    	float diffPhaseCorrection;
    	float phaseOut;
    
    	// incremental phase variation
    	diffPhase = phase - phasePrev;
    
    	if (diffPhase > PI)
    		modFactorF = 1;
    	else if (diffPhase < - PI)
    	    modFactorF = -1;
    	else
    		modFactorF = 0;
    
    	diffPhaseMod = diffPhase - modFactorF*2*PI;
    
    	// preserve variation sign for +pi vs. -pi
    	if ((diffPhaseMod == -PI) && (diffPhase > 0))
    		diffPhaseMod = PI;
    
    	// incremental phase correction
    	diffPhaseCorrection = diffPhaseMod - diffPhase;
    
    	// Ignore correction when incremental variation is smaller than cutoff
    	if (((diffPhaseCorrection < PI) && (diffPhaseCorrection>0)) ||
    			((diffPhaseCorrection > -PI) && (diffPhaseCorrection<0)))
    		diffPhaseCorrection = 0;
    
    	// Find cumulative sum of deltas
    	*diffPhaseCorrectionCum = *diffPhaseCorrectionCum + diffPhaseCorrection;
    	phaseOut = phase + *diffPhaseCorrectionCum;
        return phaseOut;
     }
    

    And only one range-bin was measured by Vital signs lab.

    sensorStop
    flushCfg
    dfeDataOutputMode 1
    channelCfg 15 3 0
    adcCfg 2 1
    adcbufCfg -1 0 0 1 0
    profileCfg 0 60.25 7 6 57 0 0 65 1 200 4000 0 0 40
    chirpCfg 0 0 0 0 0 0 0 1
    frameCfg 0 0 2 0 50 1 0
    lowPower 0 1
    guiMonitor 0 0 0 0 1
    calibDcRangeSig -1 0 0 0 0
    vitalSignsCfg 0.5 0.5 256 512 4 0.1 0.05 100000 300000
    motionDetection 1 20 2.0 0
    sensorStart

    The red line is unwrapPhasePeak_mm sent by mmwave.

    The blue line unwarped the Range-bin's img and real values using the unwrap function we converted to Python code.

    Because only one range-bin is enabled, two data(img and real values, unwrapPhasePeak_mm) are from the same range-bin.

    Best regards

    CH Cho.

  • HI, 

    Here is the reply from our design expert: 

    ------------------------

    The 2nd and 3rd parameter of the unwrap function   unwrap(float phase, float phasePrev, float *diffPhaseCorrectionCum) depends on the phase values from previous frames.

    When the user is implementing his own function in Python these previous phase values probably do not match with what the real-time code would be using.

    For example when the user starts saving the UART data (by checking the Save Data checkbox on the GUI) the data might have started saving form frame 10 (as an example) so the user’s initial phase value is from frame 10 in offline processing in Python while in the red curve (the output from the variable unwrapPhaePeak_mm) the initial phase value is from frame 1.

    The shape of the waveforms are the same. I don’t think the differences in the offset/scales make any difference in terms of the algorithm.

    ------------------------------------

    Hope it explains what you see.

    Best,

    Zigang