This thread has been locked.

If you have a related question, please click the "Ask a related question" button in the top right corner. The newly created question will be automatically linked to this question.

IWR6843AOPEVM: Vital Signs Lab on IWR6843AOPEVM: No Plot and No Data Captured by GUI

Part Number: IWR6843AOPEVM
Other Parts Discussed in Thread: MMWAVEICBOOST, IWR6843AOP, UNIFLASH

Hi,

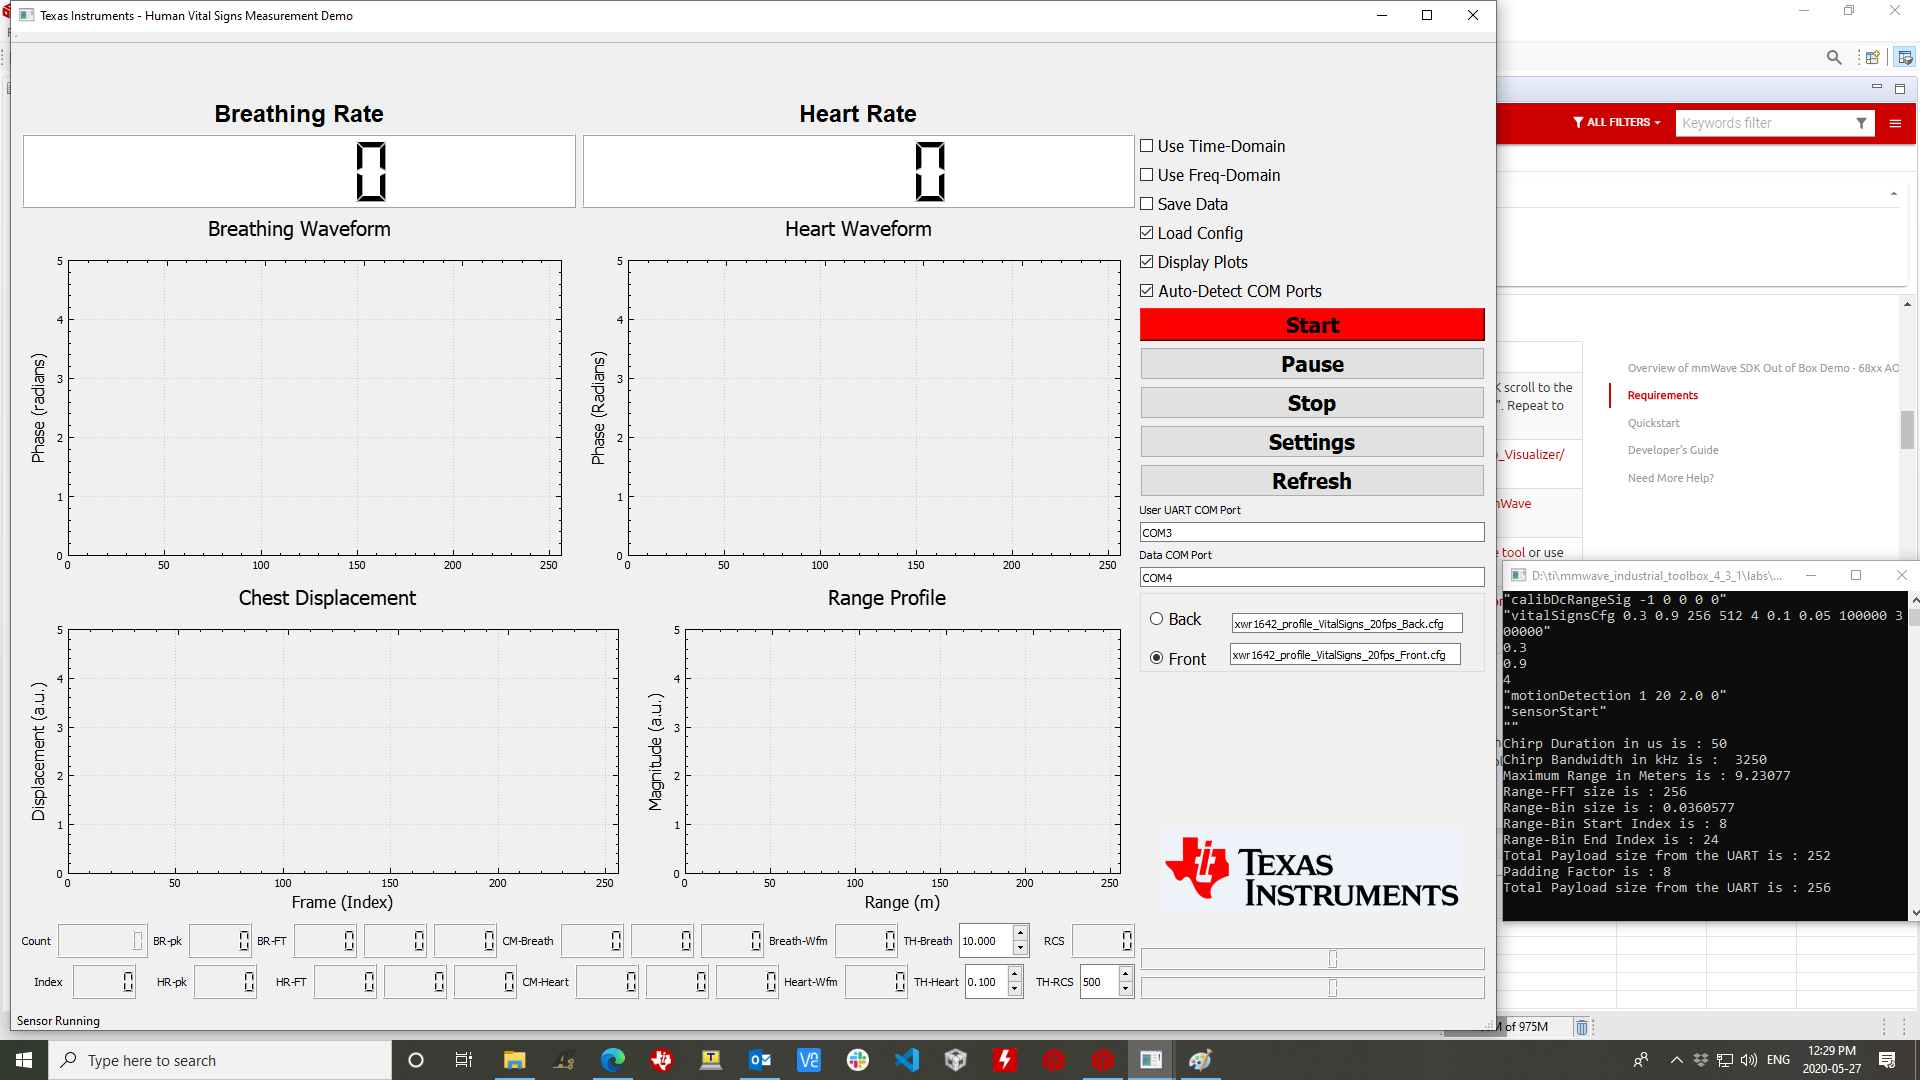
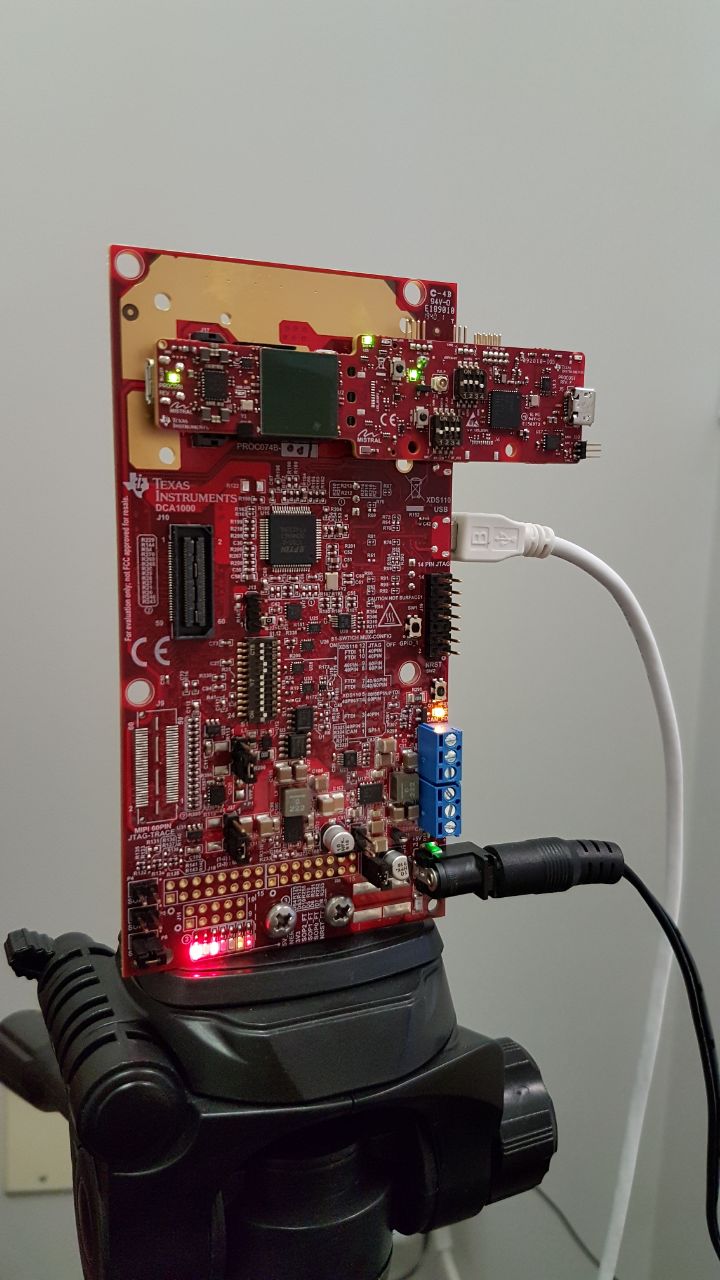
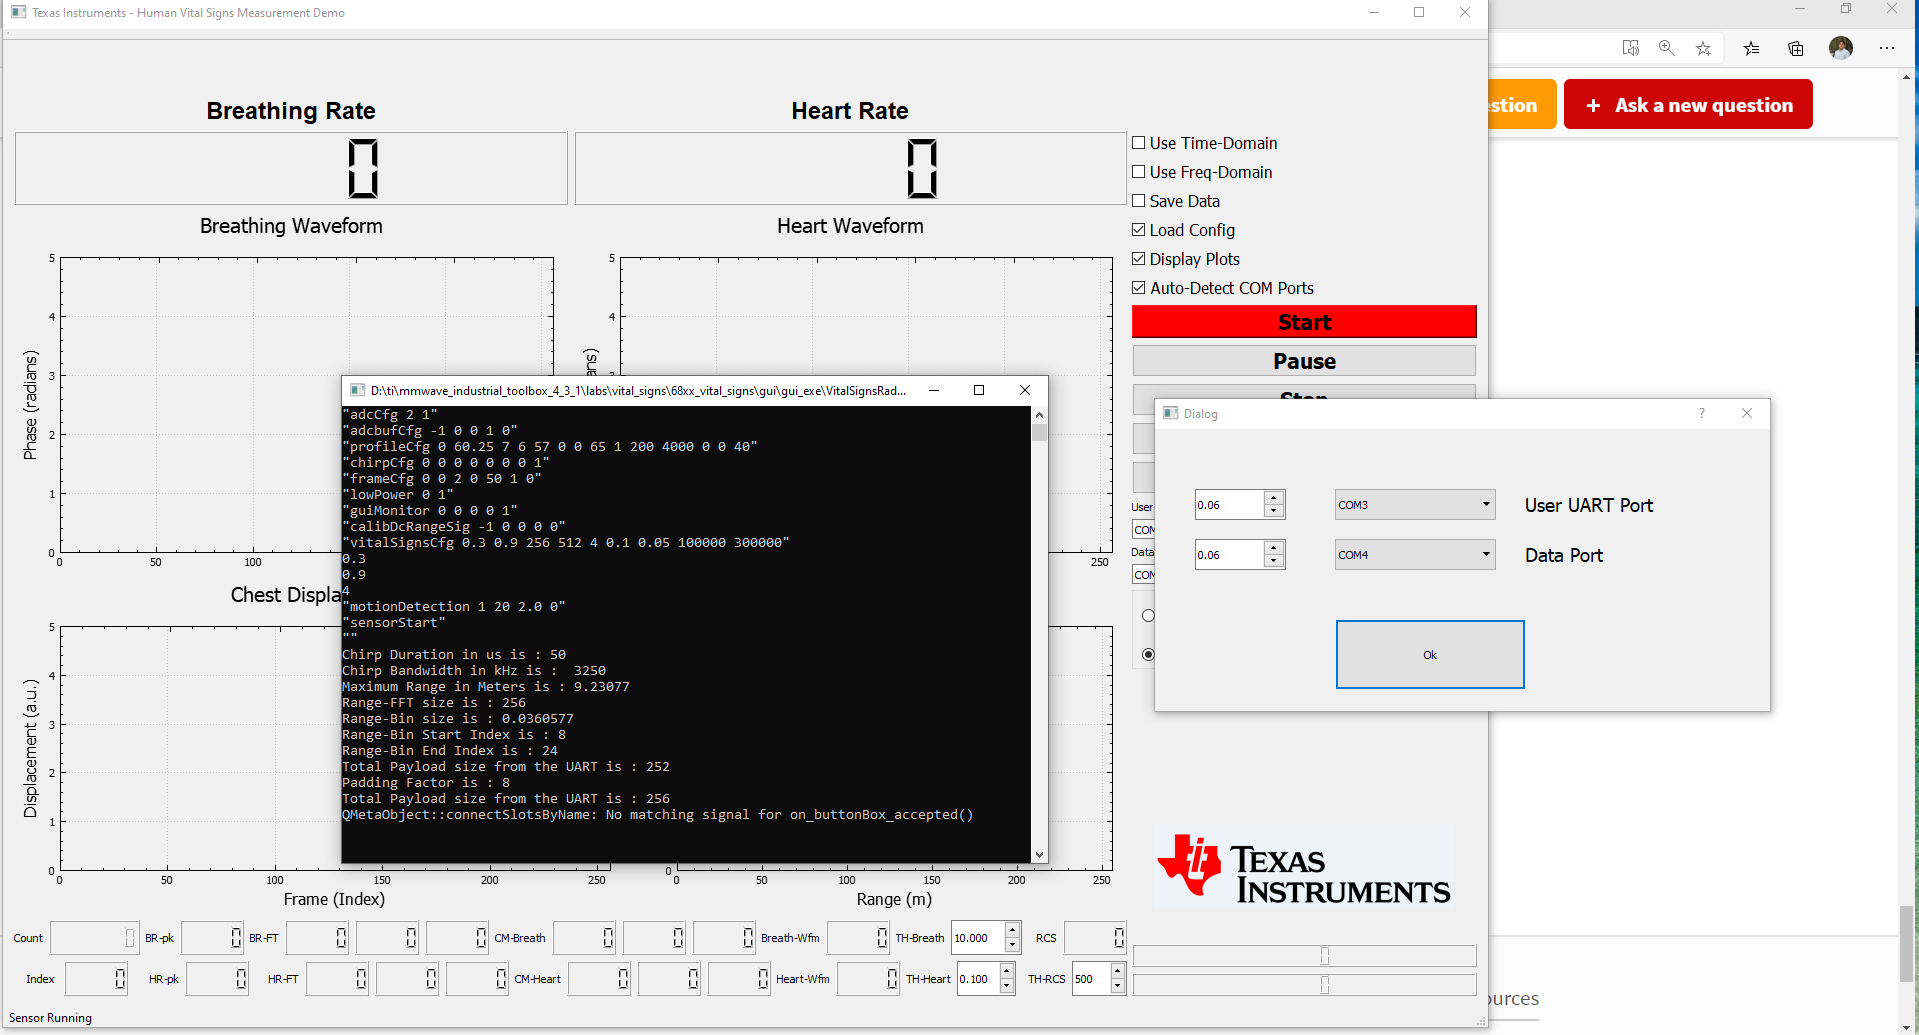
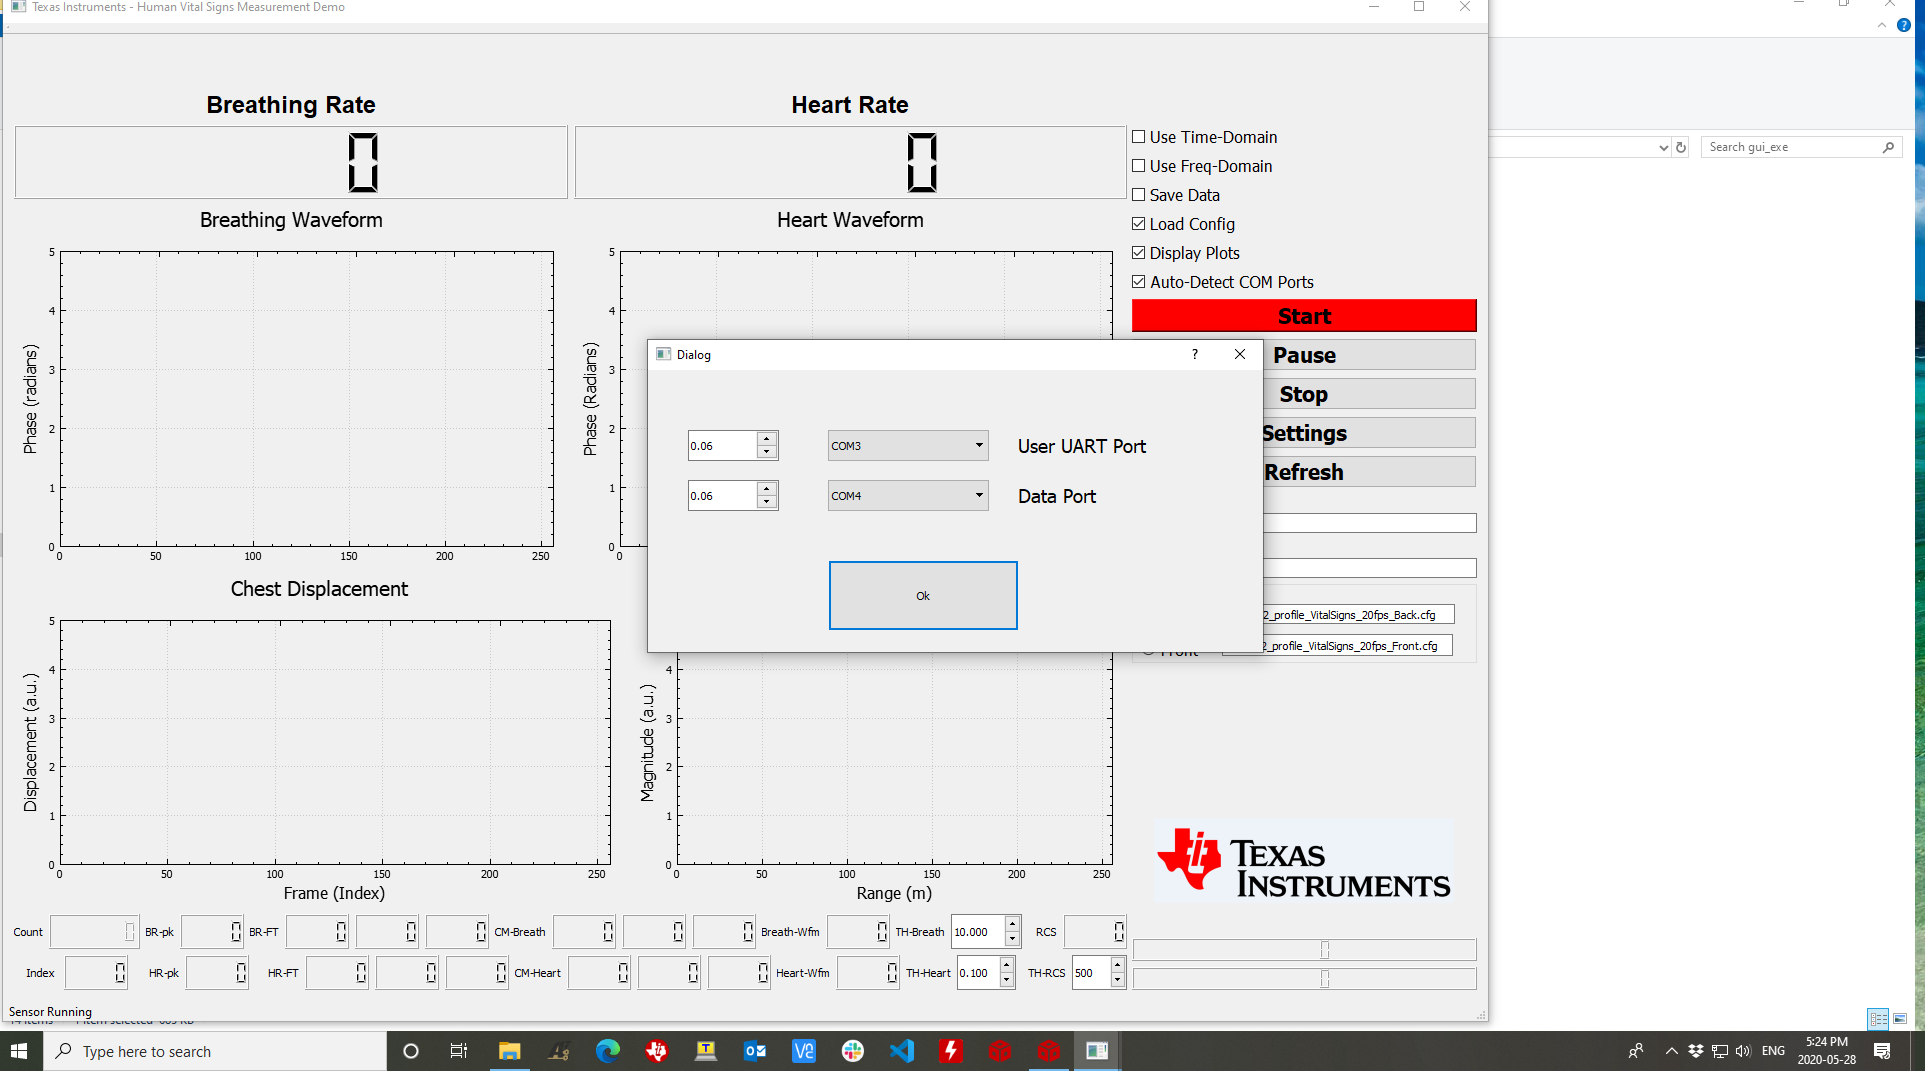
I wanted to run the vital signs demo lab on IWR6843AOPEVM connected to MMWAVEBOOST. Flashed the EVM with both "vital_signs_demo_68xx.bin" and "vital_signs_demo_68xx_aop.bin". No success with getting any results on vital signs GUI - no plots and no data captured.

Could run the out of the box demo with no problem but the vital signs lab fails to show any result on the GUI.

Any idea where I should start to debug the issue? Please let me know.

Thanks.

  • Dear WatMil:

    To start lets do some hardware verifications.

    1. Are you using a 5V 3A power adapter?

    2. Are the 12 switches on the MMWAVEICBOOST 0111 1110 0111?

    3. When you flash device do you cycle power once you put the SOP2 jumper in place and after you remove?

    Let me know where you stand with these steps and we can move forward.

    Best regards,

    Connor Desmond

  • Thanks for your reply.

    To confirm:

    1. Yes I used 5V 3A supply

    2. Switches on the MMWAVEICBOOST are the same as you said

    3. I did power cycle the device before and after removing the SOP2 jumper

    Can this be related to a SW issue?

    Regards

  • Dear WatMil:

    The next thing that I want you to verify is that you can run the OOB demo. This step will help us isolate where the issue you might be. Let me know if you can successfully run the OOB demo with your device.

    Best regards,

    Connor Desmond

  • Thanks for your follow-up.

    I ran the OOB recently with no problem. I can see the plots and data points on the demo visualizer tool.

    Flashed the SFLASH then, downloaded the bin file for vital signs lab and again nothing showing up on the GUI plot as you can see in this post.

    Here is the output from GUI command window:

    QT version = 5.9.1
    QMetaObject::connectSlotsByName: No matching signal for on_buttonBox_accepted()
    Serial Port Found
    Data Port Number is "COM4"
    User Port Number is "COM3"
    Data port succesfully Open
    User port succesfully Open
    Configuration File Name Read from the GUI is %s/n "xwr1642_profile_VitalSigns_20fps_Back.cfg"
    QMetaObject::connectSlotsByName: No matching signal for on_buttonBox_accepted()
    "COM3"
    Configuration File Path is %s/n "D:/ti/mmwave_industrial_toolbox_4_3_1/labs/vital_signs/68xx_vital_signs/gui/profiles/xwr1642_profile_VitalSigns_20fps_Front.cfg"
    "sensorStop"
    "flushCfg"
    "dfeDataOutputMode 1"
    "channelCfg 15 3 0"
    "adcCfg 2 1"
    "adcbufCfg -1 0 0 1 0"
    "profileCfg 0 60.25 7 6 57 0 0 65 1 200 4000 0 0 40"
    "chirpCfg 0 0 0 0 0 0 0 1"
    "frameCfg 0 0 2 0 50 1 0"
    "lowPower 0 1"
    "guiMonitor 0 0 0 0 1"
    "calibDcRangeSig -1 0 0 0 0"
    "vitalSignsCfg 0.3 0.9 256 512 4 0.1 0.05 100000 300000"
    "motionDetection 1 20 2.0 0"
    "sensorStart"
    ""
    "sensorStop"
    "flushCfg"
    "dfeDataOutputMode 1"
    "channelCfg 15 3 0"
    "adcCfg 2 1"
    "adcbufCfg -1 0 0 1 0"
    "profileCfg 0 60.25 7 6 57 0 0 65 1 200 4000 0 0 40"
    "chirpCfg 0 0 0 0 0 0 0 1"
    "frameCfg 0 0 2 0 50 1 0"
    "lowPower 0 1"
    "guiMonitor 0 0 0 0 1"
    "calibDcRangeSig -1 0 0 0 0"
    "vitalSignsCfg 0.3 0.9 256 512 4 0.1 0.05 100000 300000"
    0.3
    0.9
    4
    "motionDetection 1 20 2.0 0"
    "sensorStart"
    ""
    Chirp Duration in us is : 50
    Chirp Bandwidth in kHz is : 3250
    Maximum Range in Meters is : 9.23077
    Range-FFT size is : 256
    Range-Bin size is : 0.0360577
    Range-Bin Start Index is : 8
    Range-Bin End Index is : 24
    Total Payload size from the UART is : 252
    Padding Factor is : 8
    Total Payload size from the UART is : 256

  • Please see the attached photo

  • Here is also the hardware setup for your kind review:

  • Do you provide any instructions on how to build the GUI from the source codes you provided?

    Is there any other way to make sure the pre-built exe file is working properly? 

    For the IWR14xx series, we could use MATLAB to run the GUI but I didn't see this option in IWR68xx. Please advise the best way to debug this issue and make sure the software is working. 

    I will try to build the CCS source codes and run the board via debug mode to make sure the software on EVM is working properly. I will update the results here in this thread. 

    Let me know please if you need more information to help debugging this issue. 

    Thank you.

  • Update:

    I built mss and dss projects of vital signs lab. Flashed the device with the generated bin file. Still no luck with the GUI. No data, no plot. I'm now running the lab in debugger mode. Will update this thread after that. 

  • Update: 

    Went through the debugging path. I got this in console:

    [Cortex_R4_0] **********************************************
    Debug: Launching the Vital-Signs Monitoring Demo
    **********************************************
    Debug: VitalSignsDemoMSS Launched the Initialization Task
    Debug: VitalSignsDemoMSS mmWave Control Initialization was successful
    Error: Unable to open the CLI
    [C674X_0] Debug: MMWDemoDSS mmWave Control Initialization succeeded
    Debug: MMWDemoDSS Data Path init succeeded
    Debug: MMWDemoDSS initTask exit

    Still no data and no plot on the GUI while the project was running in the debugger mode. 

    What's that "Error: Unable to open the CLI"? Any idea?

    Regards

  • Dear WatMil:

    Can you please verify that when you open the GUI executable and go into settings that you can see that the COM ports are present for both data and user. And if the fields are blank that means that the GUI can not see them. If that is the case I need you to run the OOB in your setup even if worked in the past so that we can verify that data can be sent from ICBOOST to your machine. Do this and we can move forward.

    Best regards,

    Connor Desmond

  • Hello, 

    Thanks for your follow-up.

    Please take a look at the attached picture. These fields are filled correctly as you can see. However when I click on the settings, a message is shown on the command line window as attached here.

  • Dear Connor,

    Please see the following photos as I run the OOB lab.

    Everything seems to be working in the OOB lab but there seems to be a problem with the vital signs GUI. Please advise what should be the next debugging step? 

    Can we run the MATLAB GUI provided with IWR14xx and change the configs on it to get some early results? Then we can fine tune it probably. Let me know what you think please.

  • Any idea from where can we start debugging this issue? 

    Should I look for it into the mss and dss project files or on the GUI side?

    Please let me know.

    Regards

  • Dear WatMil:

    Can you verify what revision your ICBOOST is as well as your AOP antenna module. Also can you give me the versions of the mmWave and SDK and Industrial Toolbox that you are using so that we can make sure that you are flashing the correct binary.

    Best regards,

    Connor Desmond

  • Dear Connor,

    I'm using MMWAVEICBOOST Rev. B and IWR6843AOP Rev. F.

    Here are my software versions and runtime libraries:

    mmWave SDK 3.03.00.03

    mmWave Industrial Toolbox 4.3.1

    Microsoft Visual C++ 2015-2019 Redistributable

    As a further point, I tested the GUI on another PC and got the same thing. OOB works well, vital signs GUI does not show anything.

    Let me know please if you have any other questions. Still wandering around and couldn't get any data from the GUI. Looking forward for your support. 

    Regards

  • Dear WatMil:

    If you could install the most recent versions of the SDK and Industrial Toolbox, and if you are not already using it make sure that you are flashing using UniFlash. Then follow the Vital Signs user guide from that Industrial Toolbox and lets go from there.

    Best regards,

    Connor Desmond

  • Thanks for your follow-up.

    I did. I installed the SDK 3.4.0.3 and latest version of Industrial Toolbox (4.3.1). Still no luck with getting any data from the GUI. I followed all of your guidelines exactly step by step. I was an instructor for embedded systems lab at colleges and universities and I know most of these issues arise because of not following the guidelines or lab procedure step by step. In this case, I followed everything exactly as provided and triple checked everything to make sure nothing wrong I'm doing on my side. Is there any other way to get vital signs data other than the provided exe file? Can you please publish a guideline on how to build the GUI from its source files? That would be a great help.

    I searched the forum and it seems others had this issue as well with the pre-built GUI. Your help in this case is truly appreciated. Thanks. 

    Regards

  • Dear Watmil:

    Can you please flash the device with the following binary:

    <Industrial Toolbox Install PATH>\labs\vital_signs\68xx_vital_signs\prebuilt_binaries\vital_signs_demo_68xx.bin

    Let me know if you can run the demo by using this binary.

    Best regards,

    Connor Desmond

  • Dear Connor,

    Thanks for your response. I flashed the binary as you said "vital_signs_demo_68xx.bin". Still getting the same on GUI. No plots no captured data. Can this be related to any SW issue on the GUI itself? How can we rule that out? Let me know please. 

    Thank you.

    Regards

  • Dear Watmil,

    Currently we do not support the Vital Signs Demo for the IWR6843AOP ES2.0 device. The provided binaries only work with ES1.0 devices.

    Best regards,

    Connor Desmond

  • Dear Connor,

    Thanks for your response. You mean the Rev. C of IWR6843AOP? The one that is deprecated? I have one of those too. Will try the lab on it and will post the results here in this thread so others can use the information provided here, too.

    Regards