Hello,
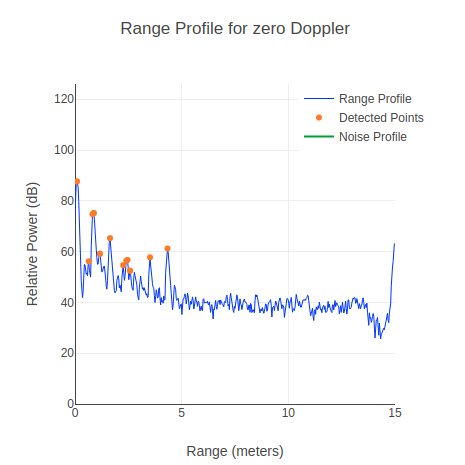
I have the radar sensor AWR1843BOOST and I need to save the acquired data for my research work as a Ph.D. student. I have used the python script to parse the binary data that I acquire with the Demo visualizer, However, that script is faulty. The data I need to save is the range profiler plot: 
However, when I try o parse this data from the .dat file I get this:
        RangeProf[0]:	011.812 11.812500
	RangeProf[1]:	012.410 12.410156
	RangeProf[2]:	012.560 12.559570
	RangeProf[3]:	012.964 12.963867
	RangeProf[4]:	013.163 13.163086
	RangeProf[5]:	012.814 12.814453
	RangeProf[6]:	012.103 12.102539

....


I can not find a possible association with the plot in the image

