This thread has been locked.

If you have a related question, please click the "Ask a related question" button in the top right corner. The newly created question will be automatically linked to this question.

IWR1443BOOST: Range profile

Part Number: IWR1443BOOST

1134.RX1.txt

Hi, i acquirred this raw data through UART. and i would like to plot the range profile.  This is the data from channel 1 that i isolated.

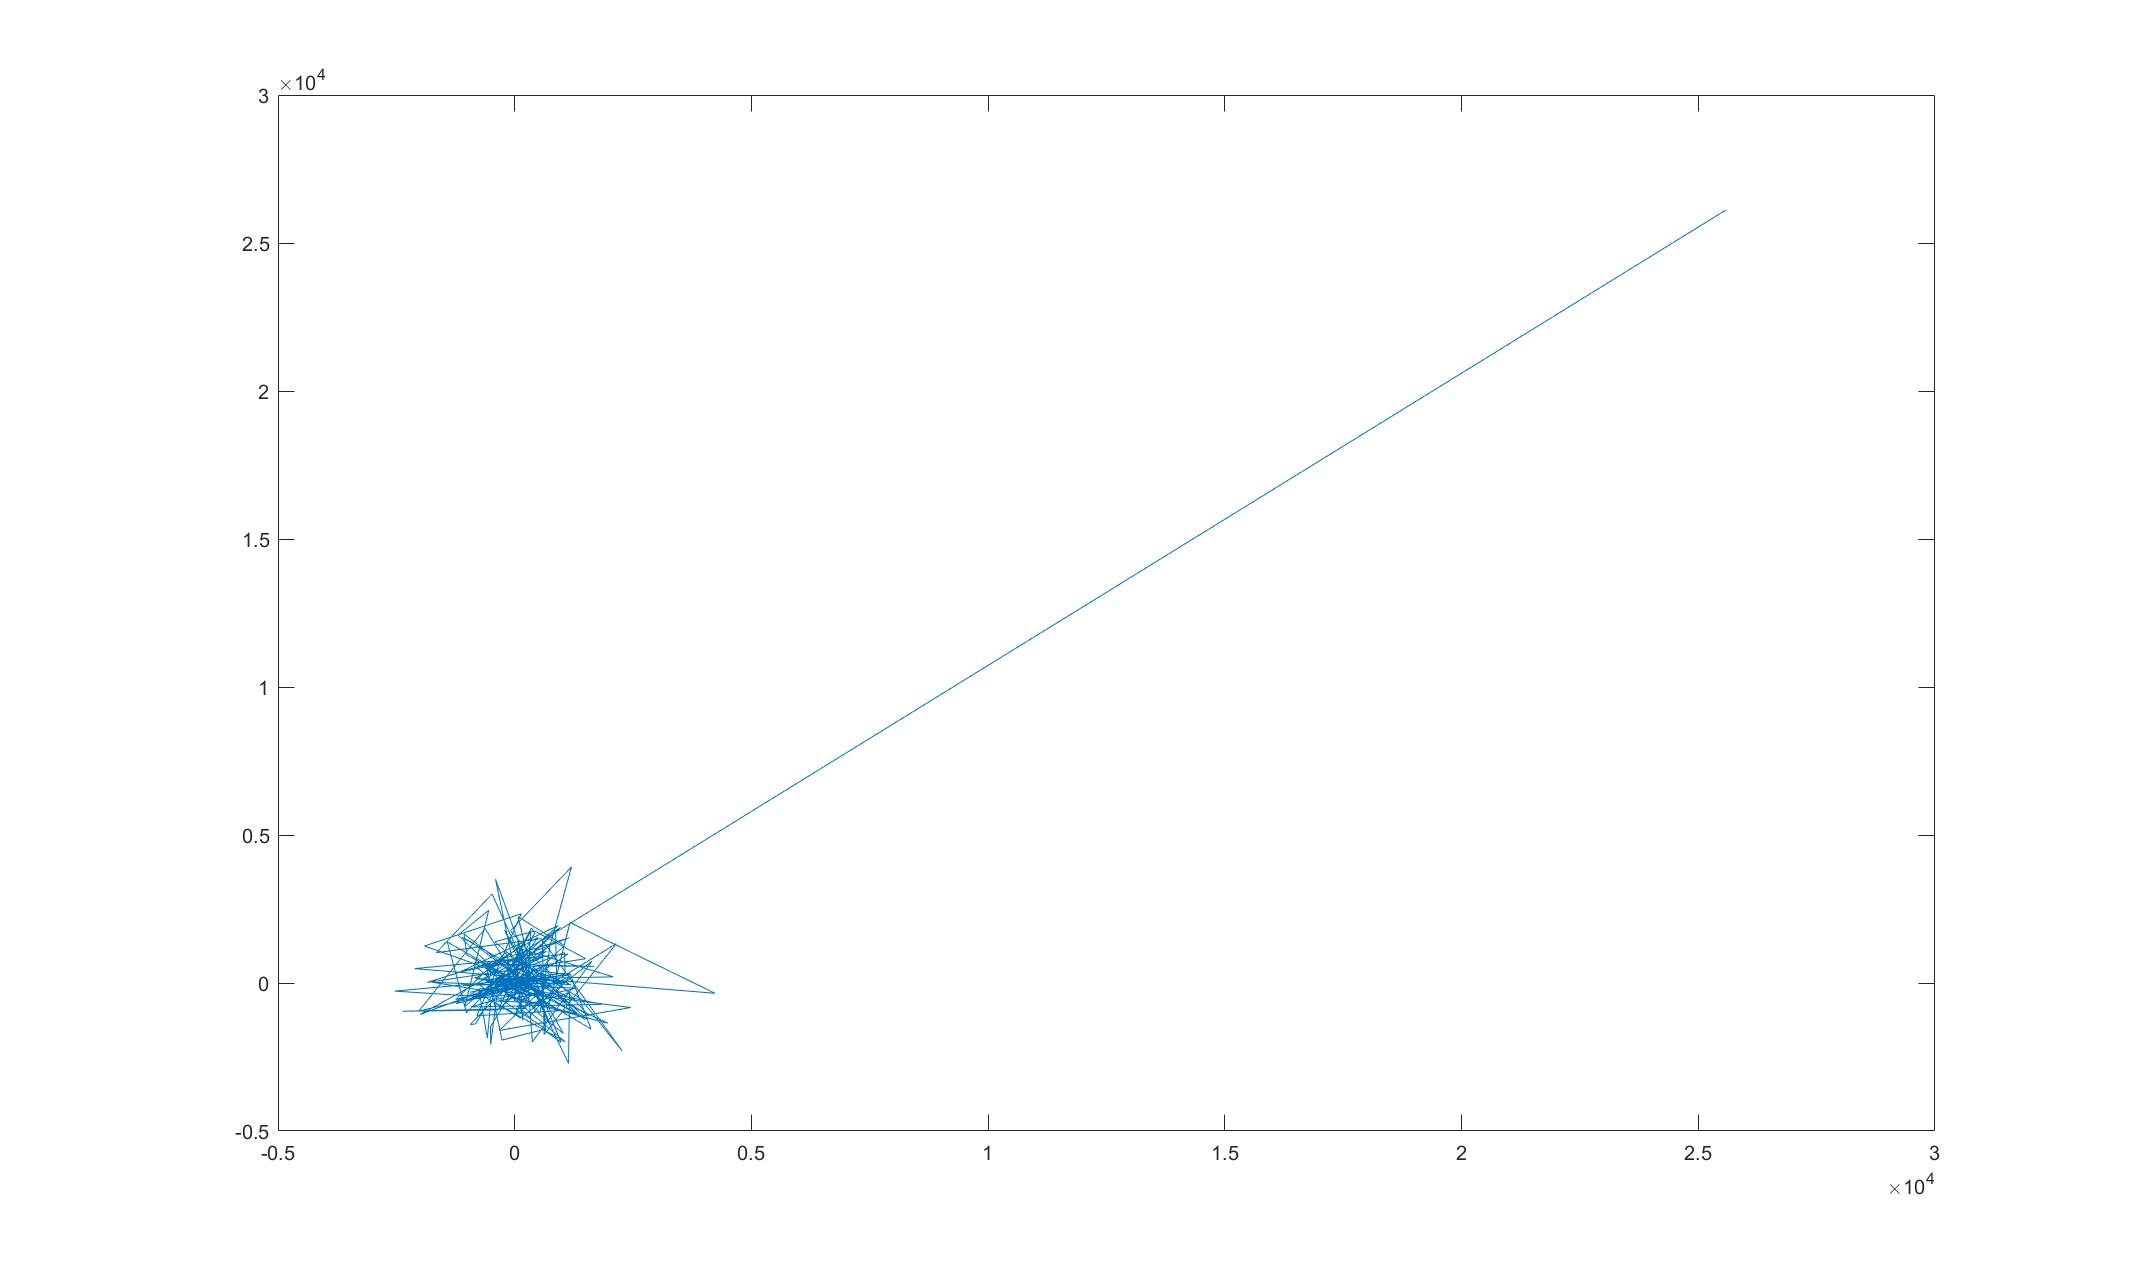
Please can you tell me, how i can do the 1D FFT-Range. I tried to apply a blackmann window and then did an fft but i got this result.

and it is just not right.

can you tell me, what i do wrong and mostly how i get the y axis, because i notice, that by just plotting the fft i get as y-axis: the imaginar part of the fft data and x-axis : real part.

what i need is y-axis : amplitude and x-axis: distance (range)

  • Hello

    We would request you to use DCA1000 to get the Raw data from Receiver and then proceed from there.

    Please help us understand how you have captured the Raw data from Uart as typically our demos provide post processed data on uart port.

    Regards

    Vaibhav

  • Just as Vaibhav mentioned we are not sure how you get the ADC raw data through UART.   Please explain that. 

    Now let us assume you have obtain the data correctly.  If you plot the amplitude value (absolute value) of the range FFT output,  it will start to make some sense to you.  

    But the range profile we plot in visualizer is calculated as below:

    1) Apply range FFT

    2) Apply Doppler FFT

    3) Sum the power of Doppler FFT output over different antennas.

    4) Plot the zero Doppler bin of (3). 

    Best,

    Zigang

  • hi,

    I got the data from the M0 memory : &gMmwHwaMemBuf[0]

    This is how it is defined in the labcode.

    #define VITALSIGNS_HWA_1D_ADCBUF_INP              (&gMmwHwaMemBuf[0]).

    Then i just put together the data from each channel. I saw in the technical reference book, that data are sparsed the following way:

  • We will not be able to support this method of data capture.   If you have a DCA1000 board, you can go through the radar studio to do data capture.   

    If you only have one chirp of data in your buffer, then you can just do 

    1) range FFT

    2) The range profile can be calculate as the power of range FFT output and sum over all antennas. 

    This range profile may have lower SNR (since it is not averaged over different chirp), but it should still give you the range profile.

    Best,

    Zigang