Other Parts Discussed in Thread: AWR1642
Hi,
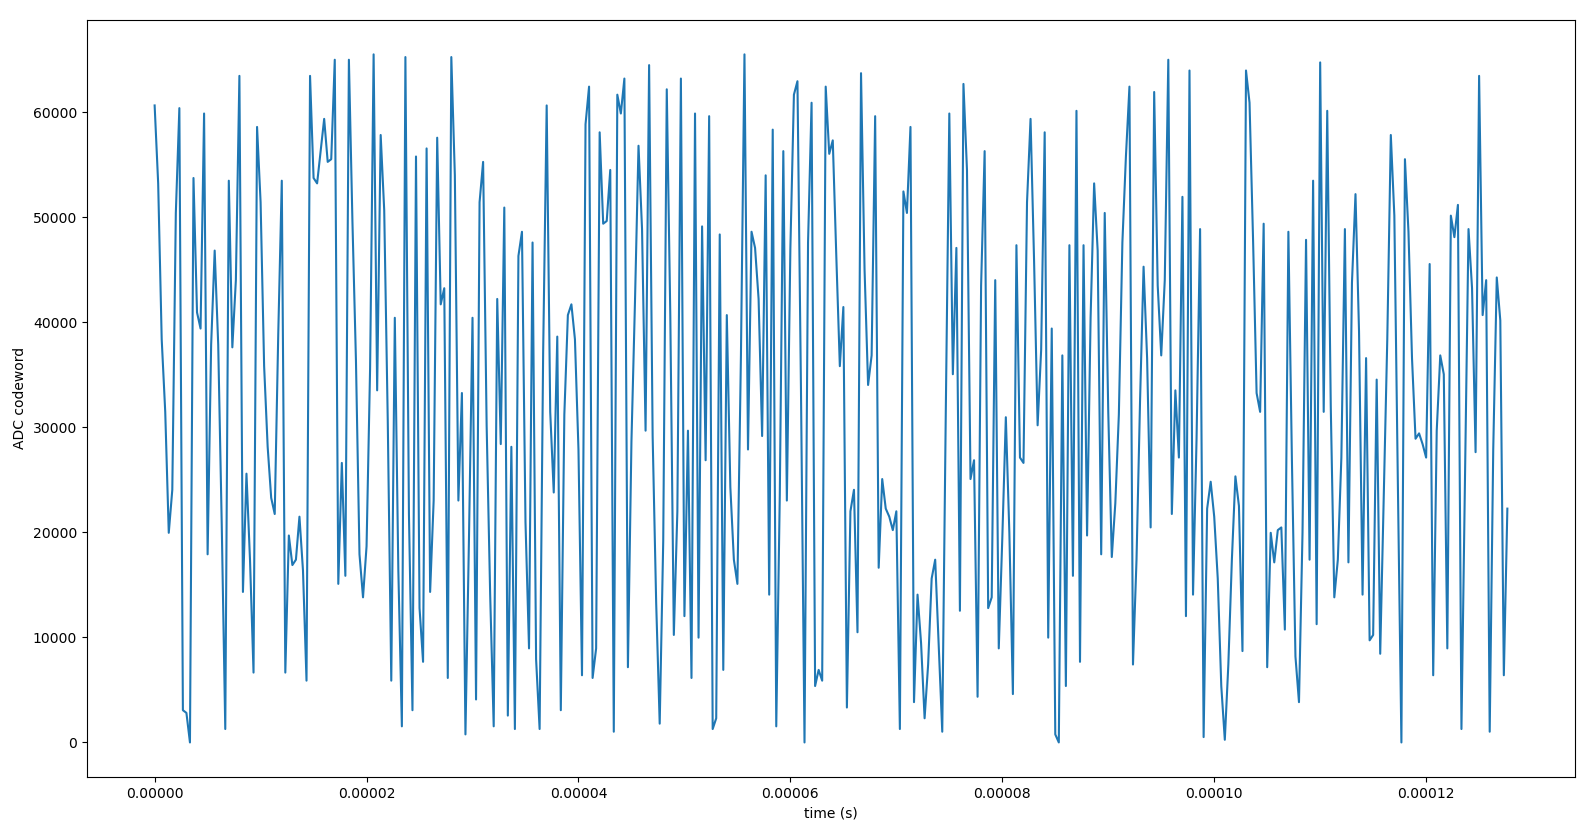
I captured a short *.bin raw ADC file and post processed it using Matlab runtime engine (for 1 TX 1 RX configuration using 2 lanes during capture). I am able to see the time domain plots as expected. I then tried to post-process the same *.bin file using a Python script but there are significant differences between the Matlab plot and what I am getting. I have included a snapshot of the first chirp of the first frame of my data in Figures below. Figure 1 is the output of Matlab PostProc and Figure 2 is the real component output for the same chirp and frame (I left the imaginary component for now for verification purposes) My expectation was to get the same real plot displayed on Matlab runtime (i.e. the blue trace indicated as 'real' on Matlab time domain plot shown in Figure1)
Following are additional notes on this exploration for your reference:
1 - I have confirmed the *.bin file size and is is exactly as I expect based on my antenna, ADC, frame and chirp settings.I also counter every single byte processed in my Python code to make sure I am processing all the data in the bin file.
2 - I have plotted the 16-bit values without performing any two's complement operations on it. So what you see in figure 2 is what is read from the bin file and arranged as described in swra581b.pdf . I checked mutiple times the format of the data arrangement in the bin file using this pdf, and all seems to be in order.
3 - Given the y-axis scale difference between time domain plot in Figure 1 and 2, there seems to be an operation I may be missing. I could not find any reference on how 16-bit I and Q values read from the *.bin file should be interpreted for post-processing purposes. All I know is they are in two's complement format and can be displayed directly as time series.
4 - The sample time instances I get in my Python code and what Matlab displays are the same. This indicates the processed number of 16-bit samples per frame per chirp match. (both time axes extend to about 0.12 ms, which is inline with my calculations using the ADC sample time and the number of ADC samples.)
I am wondering what I am missing here. Your guidance on this will be appreciated.
Regards,
Cagri
Figure 1: Matlab Post Proc Time Domain Plot

Figure 2: Time Domain Plot generated in Python for the same *.bin file as above